Analysing Gen Z's rent burden: data-driven insights into housing affordability across NSW
10 Aug 2026
Most people say Gen Z can’t afford to move out. We took every residential postcode in New South Wales and measured the rent against what people there actually earn.
The surprise is that a high rent doesn’t always mean an unaffordable place, and a low rent doesn’t always mean a cheap one. What decides affordability is the local wage. And once you measure that way, the places a young person can least afford, and the places they genuinely can, aren’t the ones you’d guess.
All of the following analysis was done in Power BI using the following datasets: NSW Fair Trading’s rental bond lodgements (2025), the ABS 2021 Census for age and income by postcode, and ABS postcode boundaries for the maps. Suburb names came from the Australian Postcodes dataset.
Who are we talking about?
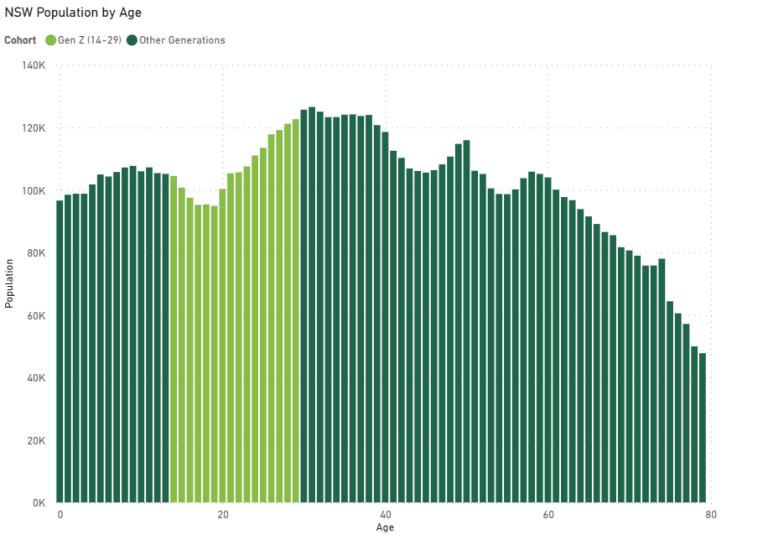
We’ve defined Gen Z as ages 14 to 29 (born roughly 1997 to 2012), using the closest Census age bands. There are about 1.71 million Gen Zs in NSW, amounting to 21% of the population. That’s one in five of us, all eventually needing somewhere to live that isn’t the childhood bedroom.
Where does Gen Z actually live?
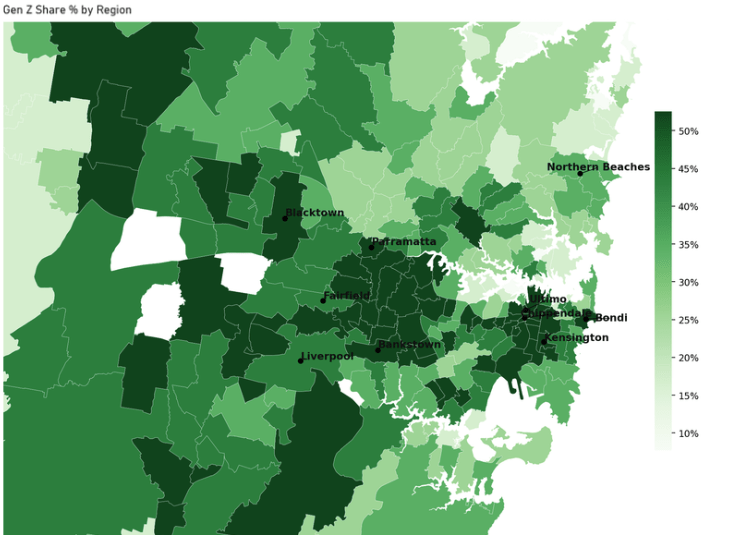
The densest concentrations are the inner south and inner west of Sydney (Chippendale, Ultimo, Kensington, the university belt) and the middle of Western Sydney (Parramatta, Bankstown, Fairfield). The leafy, expensive edges, the Northern Beaches, the harbourside north, have comparatively few young people. Young people cluster around universities and cheaper, denser housing, not postcard views.
Where’s the rent?
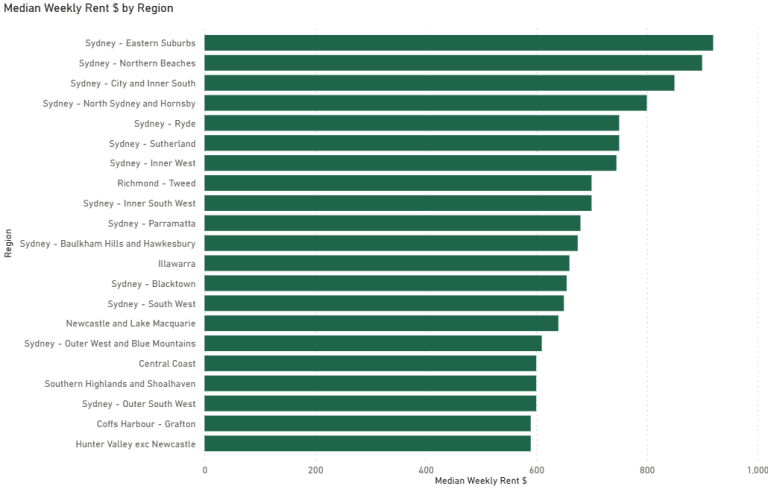
The Eastern Suburbs top the list at about $920 a week, the Northern Beaches at $900, then the City and Inner South, then North Sydney. Expensive rent is where it’s always been: the coast and the harbour.
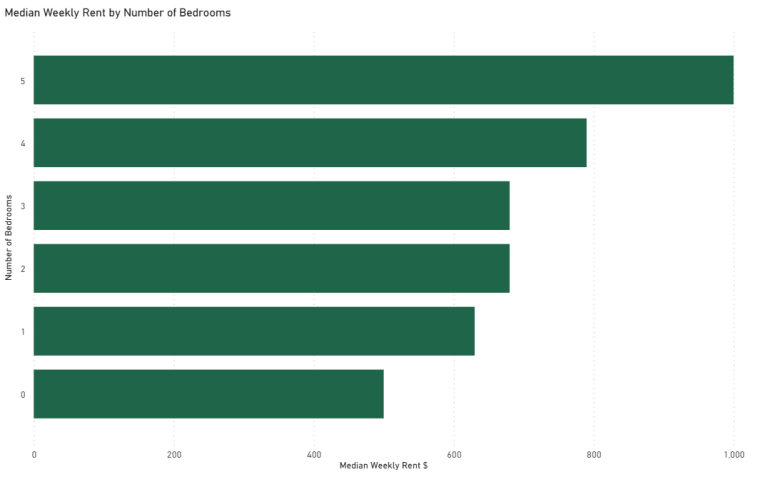
Two smaller cuts stood out. By bedrooms, there’s no cheap rung: a studio already runs about $500 a week, a one-bedroom $630, a two-bed $680.
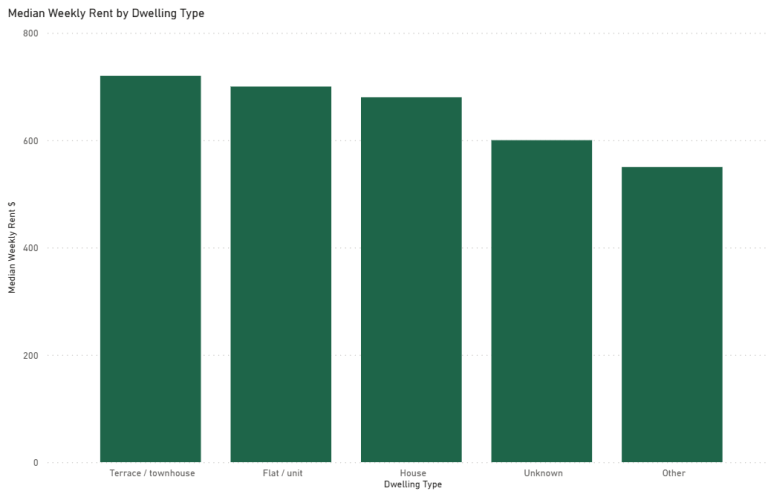
By dwelling type, we expected units to be cheaper than houses. Instead, a unit ($700) rents for slightly more than a house ($680), because cheap houses sit in the outer suburbs while units cluster in the pricey inner city. Type of home barely moves the number. Location is the more important factor, and that’s exactly what a young person tied to a city job or university can’t easily change.
Putting the two together: the rent burden
Divide annual rent by annual income and you get a rent burden, so how much of a person’s pay the rent swallows. The standard measure, AHURI’s 30:40 rule, flags housing stress above 30% of income for the bottom 40% of earners. Ours is stricter: personal income rather than household, and the 30% line applied to every postcode, not just low earners. Read the numbers as a solo affordability test, not the official stress rate.
Every NSW postcode comes out above 30%. The median burden is 77%, so on one income, rent alone eats three-quarters of the pay packet almost everywhere. Pool two incomes and the median drops to about 35%, which is why sharing a house is arithmetic, not lifestyle.
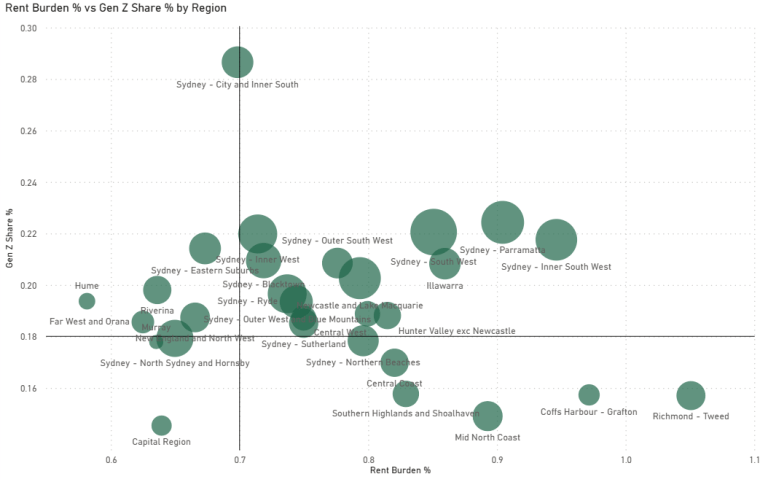
The regions with the most Gen Z (Parramatta, the South West, Illawarra) sit at high burden. The regions with the highest rents (the Northern Beaches, North Sydney) are among the oldest. Young and expensive are mostly different parts of the city; the exception is the City and Inner South, the student belt.
Leave the city, and rent stops predicting affordability. Regional New South Wales looks cheap by raw rent, but against local wages, it is not actually cheap. The working inland, the Far West and the Riverina, is genuinely affordable, rent taking about half a local income, which is why some move there and buy a first home. The lifestyle cost is the trap: in Byron and the Tweed, holiday-town rents meet low local wages and swallow almost a whole pay packet, more than most of Sydney.
The worst-hit postcodes
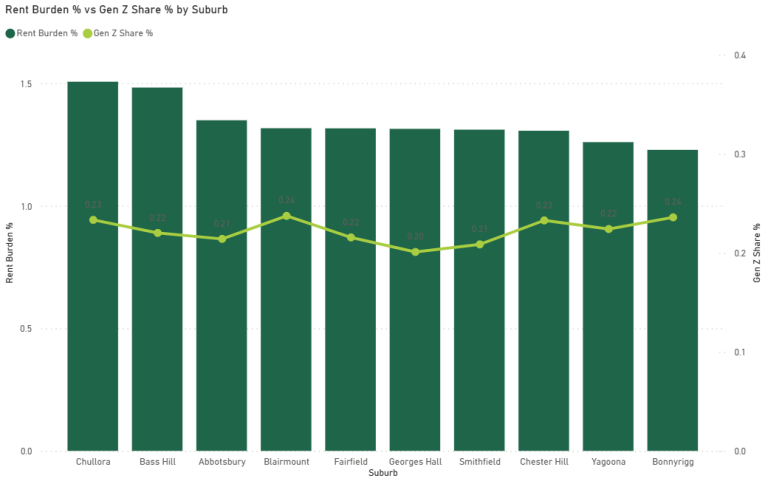
Sort for young population plus high burden, and Western Sydney dominates the list: Bass Hill, Fairfield, Smithfield, Chester Hill, Yagoona, Bonnyrigg, Ashcroft, Carramar. The youth barely moves across them, every suburb sits around 20 to 23% Gen Z, while the burden climbs from 110% to 150% of a single pay packet, measured against local incomes. Not the harbour, not the beaches. The quiet middle of the city, where the squeeze is tightest because wages are lowest.
Do young people even live where it’s cheap?
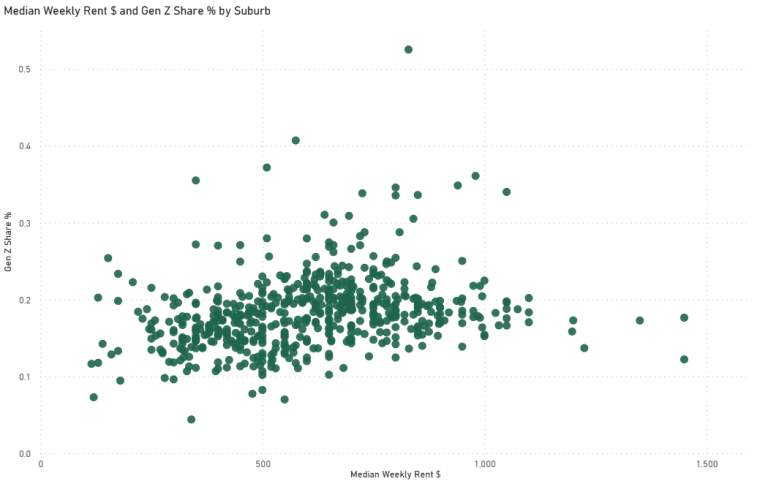
We expected the data to confirm the obvious. It didn’t. If Gen Z chased cheap rent, this scatter would slope downward. Instead it’s flat. Across 495 postcodes the correlation between rent and Gen Z share is just 0.23, and if anything leans slightly positive, the opposite of chasing cheap rent. Rent explains only about 5% of where young people live. Something else drives it: universities, jobs, transport, and the communities they already know. They absorb the cost, or share to survive it.
The exceptions that prove the rule
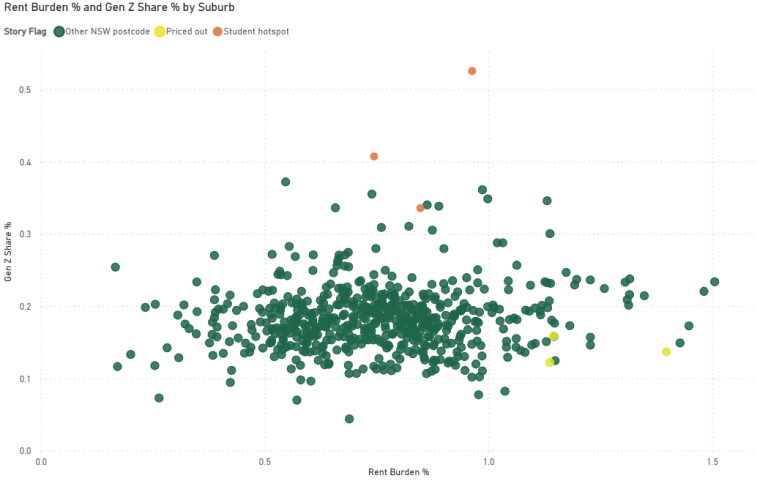
Chippendale (2008) has the highest Gen Z share in the state, 52%, and a rent burden near 96%. That’s not affordability. It’s share houses and four-to-a-terrace next to the University of Sydney.
Palm Beach (2108) turns out to be an older community, not a priced-out young one. Median age is 58 against 39 for NSW, with 41% of residents over 60. The sky-high rent burden here partly reflects retirees reporting little wage income, not young renters struggling to keep up.
In summary
Almost nowhere in NSW clears the 30% affordability line on a single income. The median postcode eats 77% of one person’s pay. The young aren’t where rent is highest; they’re in the inner-city student belt and across a Western Sydney middle where low wages make even moderate rents crushing. Cheap rent doesn’t explain where they live. They stay near universities, jobs and community, and pay for it in share houses and rent burden.
None of which means Gen Z never moves out. Plenty of young people do move out, just with three flatmates or most of their income handed to a landlord. What the data shows is that moving out alone, near work, on your own wage, has quietly become close to impossible across an entire state.
We’ll run this again once the 2026 Census lands, to see whether the student belts have thinned and the Western Sydney squeeze has spread. Our guess is that it has.
A note on method
Rent figures are the median of NSW Fair Trading rental bond lodgements for 2025, by postcode, excluding unknown rents and extreme outliers. Postcodes with fewer than 20 bonds or under 100 residents were dropped to avoid noisy medians. Gen Z is ages 14–29 from the 2021 Census (tables G01, G04A); income is median personal weekly income (table G02). Rent burden is annual rent over annual personal income, benchmarked against the AHURI 30:40 threshold, using personal rather than household income and no bottom-40% filter, making it a deliberately strict “can one young person afford this alone” measure.
This blog was written by Natalie.
About EdgeRed
EdgeRed is an Australian AI and data consultancy, part of The Omnia Collective group, with teams in Sydney and Melbourne. We build things that work in production – agentic AI, machine learning, data engineering, and Microsoft Fabric implementation. 250+ projects. 100+ clients. 100% Australian onshore team.