Who drinks bubble tea? What statistics can tell us about bubble tea lovers
30 Jul 2021
It seems like every shopping centre in Sydney has a place to buy bubble tea. Bubble Tea is all the rage these days. It’s sweet, tastes good, has chewy toppings and comes in massive servings. You can get it with fruity flavour or a cheese topping if you’re feeling adventurous. What’s not to love?
My co-workers are obsessed with the drink. For a while they were getting it almost daily because we had a shop within walking distance of our office. I have a confession though. It’s not my favourite drink. Maybe it’s my midwestern American tastebuds, I’d rather just have a Coke. So why do my co-workers like the drink so much? What does the standard bubble tea drinker look like? As a data analyst equipped with only Australian Bureau of Census data, a list of all the bubble tea chain shops in Sydney extracted from the biggest bubble tea chains’ websites , and a whole lot of analytics/econometric knowledge, I set out to find out if I could extract any patterns that could help me understand why they like the drink so much and why it is so popular in certain parts of the city. The major chains we pulled data from include Chatime, Coco, Gongcha, King Tea, and Share Tea, which are prominent in NSW Australia.
We’ll start with some high-level analysis before diving down. The data gathered from the bubble tea chain websites indicates there are 79 bubble tea chain stores in Sydney, scattered across 27 postcodes. The census data is all by population count in a given category, grouped by postcode. Are there any differences in the populations of postcodes with and without bubble tea?
Average population of postcode
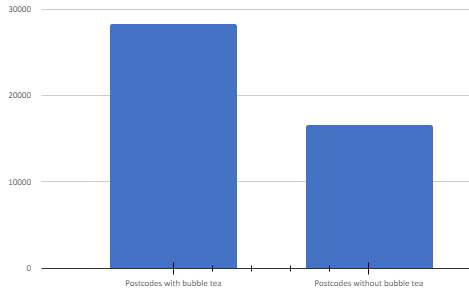
This graph is interesting, but not surprising.
Areas with a larger population are more likely to have a bubble tea shop. They have almost twice the population of areas without bubble tea. The fact that I found 65% of bubble tea shops are in shopping centres makes sense then. The most densely populated areas are sure to have the most shopping centres. In fact, 30% of all bubble tea shops in Sydney are in the CBD.
You’ll see it as an outlier data point on all scatterplots from this point forward. Other standout postcodes are Chatswood with 10% of all shops in the city, Cabramatta with 6%, and Eastwood and Burwood with 5% each. For the analysis we’ll assume a strong relationship between the postcode of residence in the census for a person and where they consume bubble tea. This is probably a fairly safe assumption outside of the CBD, where a huge proportion of the city’s business takes place.
In econometric terms, the data is almost certainly heteroskedastic based on population. In less technical terms, it doesn’t make sense to compare the large, diverse population of the CBD with the small population of Mount Kuring-Gai. This means right off the bat we must control for population in each postcode and each factor by dividing by the population of the postcode. For population variables this will give us the percent of the population with that attribute, and for factors like bubble tea stores we can analyse bubble tea store density per person.
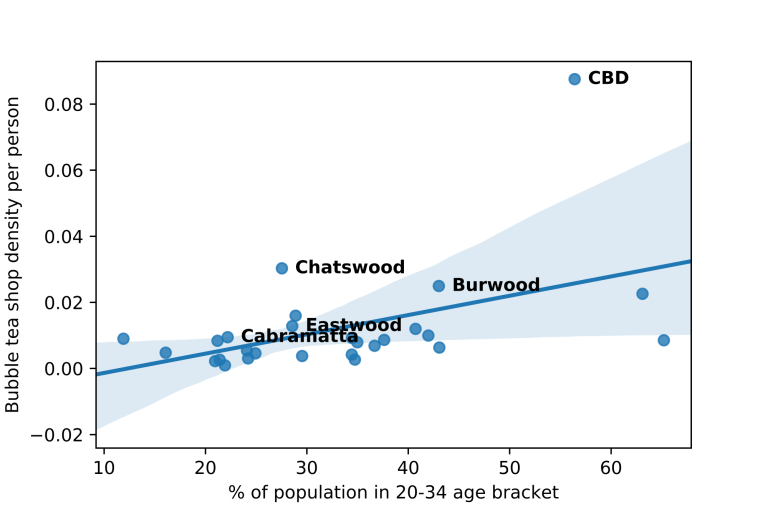
Who drinks the most bubble tea? I don’t see too many older people carrying their bubble tea around town. Kids probably aren’t buying it regularly on their own either. Note that the following scatter plot (as well as all other scatter plots in this post) is restricted to postcodes with bubble tea shops only. It shows bubble tea shop density against the proportion of 20-34 year-olds in each postcode, with the data points representing individual postcodes.
Age bracket: 20-34 years
That seems about right.
This graph shows that mostly young adults in the 20-34 age bracket are drinking bubble tea. As their percentage of the population in a postcode rises, so does the number of bubble tea shops per person.
Postcode by Income Category
Ok, how about income? It can explain about 20% of the probability of a bubble tea shop being in a specific postcode. Bizarrely, people with low to no income are more likely to drink bubble tea but are much less likely than people in some of the upper income brackets. Perhaps university students without a job really like the drink. If we group up the income brackets a bit, shown in the graph below, the results get weirder. Postcodes with bubble tea have a lower proportion in the high-income group, and a higher proportion in the low income.
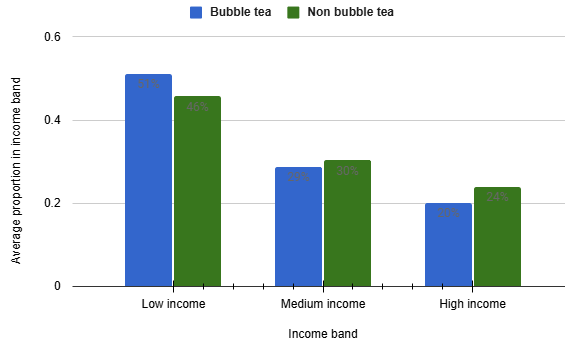
I don’t think this correlation means too much. Correlation does not equal causation. Something else is probably causing this.
Sydney is a highly diverse international city. Indeed, half of our bubble tea loving team at EdgeRed is from overseas. Maybe expats get stronger cravings for the pearls (apparently not American expats though)?
Regression Results
That seems to be the case. The data says that for every additional 1% of expats living in a postcode, we should expect the probability of a bubble tea shop in that postcode to increase by 0.0091 from a baseline of -0.2089. So, if we live in a postcode that is all expats, we would assume a 70% chance of a bubble tea shop being located there.

Statistically astute readers will note I’ve been using linear regression to extract insights from a binary probability, or probit model, and may be wondering why I’m not using logistic regression. I’m trying to infer not predict here, and the results are far less interpretable and explainable with logistic regression. We’ll get to that though, I promise.
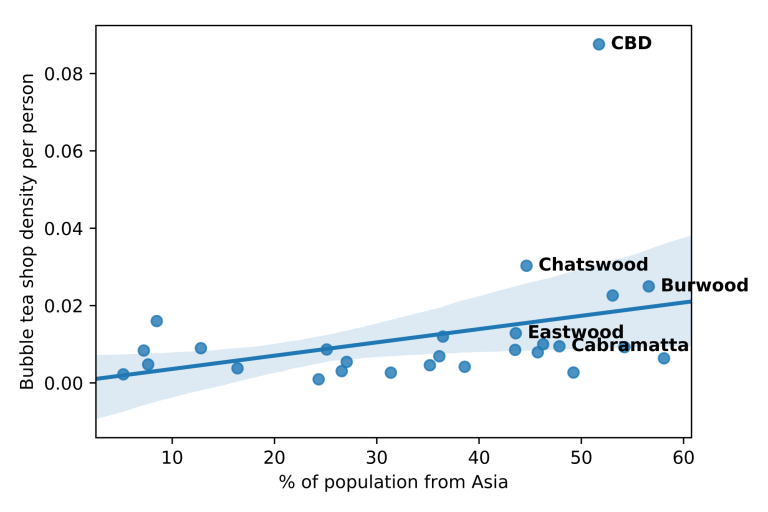
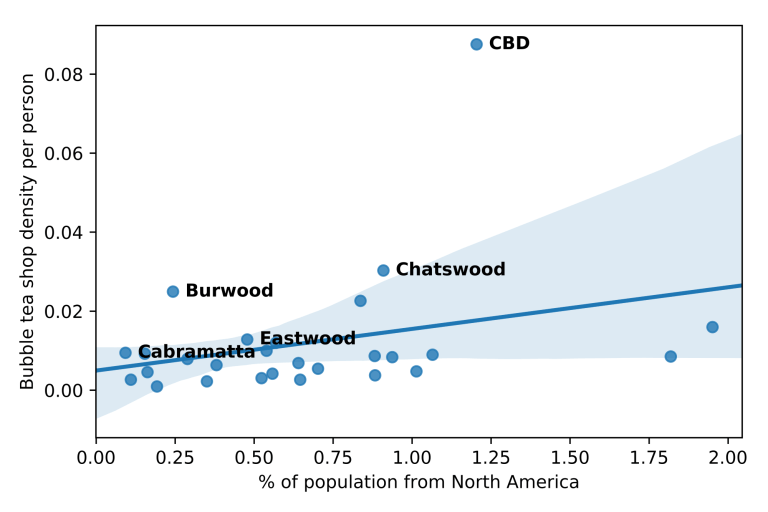
Diving a bit deeper into the country of origin of a postcode’s population, things start to get interesting. 75% of the variation in bubble tea shop density can be explained by the various countries of origin for the area’s expat population. We’ll show a quick view of the most interesting scatter plots of bubble tea shop density plotted against continent of origin for Sydney’s Population. Note Australian origins are included in Oceania.
Born overseas
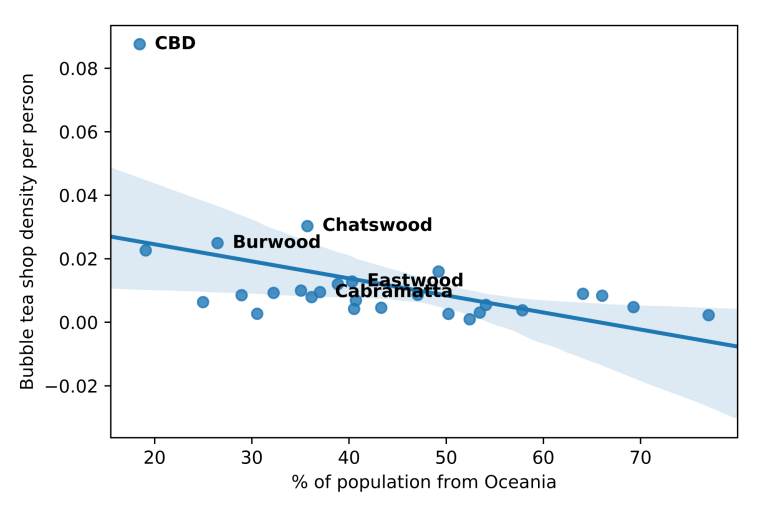
Postcodes with a higher percentage of people from Oceania have less bubble tea shops per person, with a very high concentration of almost no bubble tea shops on the upper end.
Locations with more North Americans appear to have more shops. Hmmm…. That doesn’t seem right, nobody back in my hometown even knows what bubble tea is. I didn’t until I came to Sydney. A quick glance at the x-axis shows we are working on a very different scale than that of the other regions. The percent never rises above 2% of North Americans in a postcode that has a bubble tea shop. This correlation can probably be ignored as spurious; North Americans aren’t a big enough part of the population to have an impact.
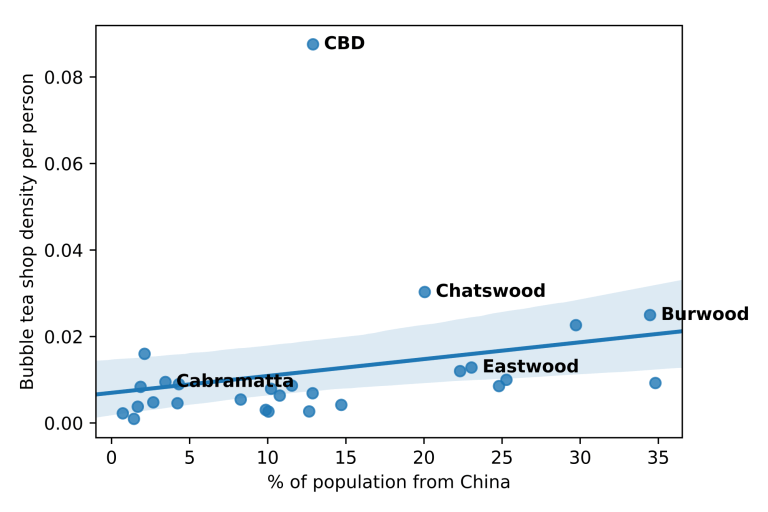
Asian expat population, including the Middle East, seems solidly positive. Let’s dive into that a bit.
Country of birth: China
Country of birth: Indonesia
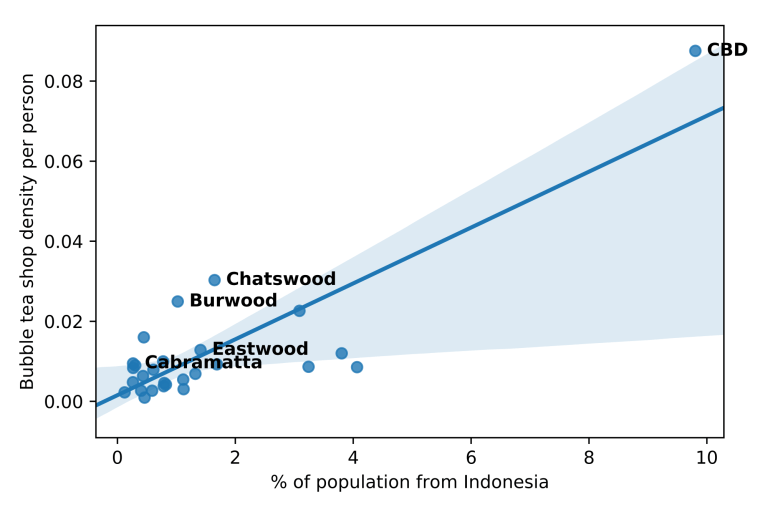
Country of birth: Thailand

Interesting.
Areas with a high percent of Indonesian and Thai expats tend to have a much higher density of bubble tea shops. Even if we ignore the outlier CBD, which is heavily Thai and Indonesian, this relationship remains clearly strong. Chinese expats make up 9% percent of Sydney as a whole, and the correlation of bubble tea shop density for Chinese population is solidly positive. This means the Chinese expat relationship is probably the most important here. Other interesting findings: expats from countries in Asia outside East Asia and Southeast Asia lower bubble tea density, and a high Vietnamese population has almost no effect on bubble tea density.
I wonder if the profession of the people in the census has any impact? Using best subset selection to select factors from a long list of professions, I found that manufacturing workers are positively correlated with bubble tea shops.
Occupation: Accommodation & Food
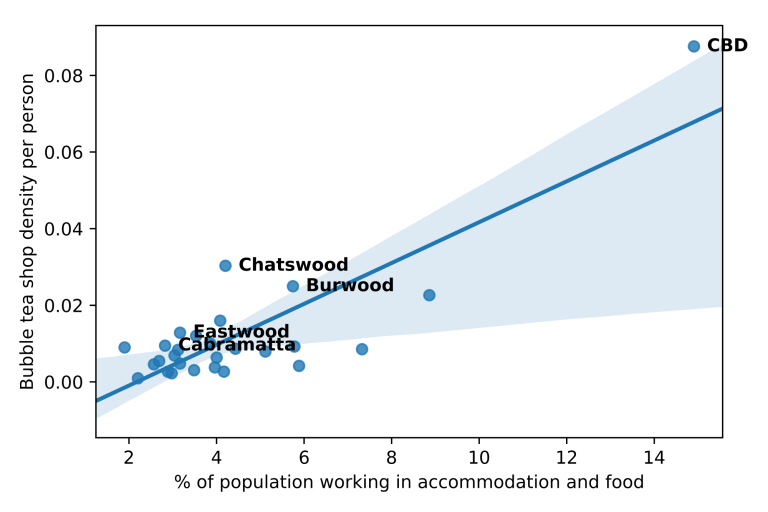
Accommodation and food services workers were extremely highly positively correlated with bubble tea shops, and were one of the most strongly correlated factors found. Transport, postal, education, and training workers are negatively correlated with bubble tea shops.
Likelihood by suburbs
Are there any areas where there really should be more bubble tea shops based on demographics that don’t have any? Using a logistic regression model combining the age groups of the postcode population and expat country of origin, we can predict where there should be bubble tea, and compare it with where there isn’t a shop currently.
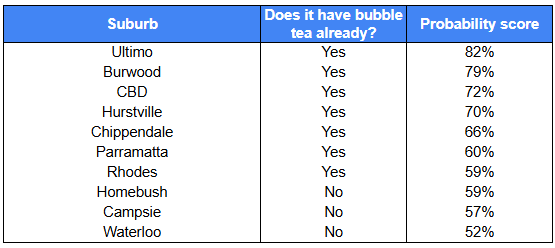
The suburbs that correspond with postcodes that could most use a large chain’s bubble tea shop are Waterloo, Homebush, and Campsie. A quick cross reference with Google maps shows that Homebush has bubble tea, but mostly small local shops. Campsie actually has a Gongcha listed in Google Maps that the company hasn’t updated on their website. Since we extracted data from the bubble tea chain websites, it won’t be in our dataset. The same thing occurred in Waterloo with a Coco tea store. If nothing else, we’ve proved the predictive power of the algorithm we used. Homebush is a good opportunity for bubble tea brands to move into a new area.
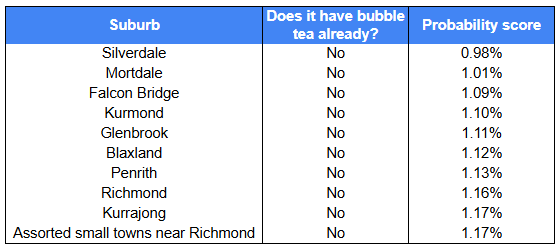
Interestingly, the worst suburbs for bubble tea are mostly clustered around Penrith and Richmond. These suburbs are out west, near or within the Blue Mountains. They are less densely populated areas, with somewhat older populations, and a relatively small expat population. Given what we know this makes sense. These characteristics would predict a lack of bubble tea shops and drinkers. The interesting exception is Mortdale, located next to one of the postcodes with the most bubble tea shops, Hurstville. Mortdale has a large population, but a very small percent of expats and young people make up that population.
What can we say about bubble tea drinkers overall? They tend to live in more densely populated areas. They are much more likely to be 20-34 years old than any other age. The best predictors of a bubble tea shop’s presence are the percent of the population in that postcode born overseas and the percent of the population working in food and accomodation. Areas with high Chinese, Thai, and Indonesian expat populations are particularly fond of the drink. Rural areas in Greater Sydney’s far west tend not to like the drink and are poor candidates for a shop. Finally, bubble tea chains should consider opening shops in Homebush; the population in the area would be very likely to consume bubble tea.
This analysis was done exclusively using public data. The potential is much larger with bigger, more focused datasets. These are usually private though. We’ve helped companies conduct market research backed by data and identify gaps and opportunities in the market. If any bubble tea execs are reading this, some transaction data would help us take this to the next level for you!
About the Author
Wil Grebner is data analytics consultant at EdgeRed Analytics with a Masters in Econometrics from the University of Sydney. He grew up in River Falls, Wisconsin, USA – a great small town nobody reading this has probably ever heard of. In his spare time he enjoys not drinking bubble tea.
About EdgeRed
EdgeRed is an Australian boutique consultancy specialising in data and analytics. We draw value and insights through data science and artificial intelligence to help companies make faster and smarter decisions.
Subscribe to our newsletter to receive our latest data analysis and reports directly to your inbox.


