Exploring Power BI: Frequently asked questions answered

What is Power BI, and How Is It Used in Data Analysis?
Power BI is a suite of business analytics tools that deliver insights throughout your organisation. Here at EdgeRed, we’re all about turning complex data into clear, actionable insights. A powerhouse tool that is often used by our clients is Power BI. It’s more than just a reporting tool; it’s a comprehensive business analytics solution that helps us – and our clients – stay ahead of the curve.
What Does Power Query Do for Power BI?
Imagine spending less time wrestling with data and more time gleaning insights. That’s where Power Query steps in. Power Query is a data transformation and data preparation engine. Our analysts use it to connect to disparate data sources, cleanse the data, and prepare it for insightful reporting (aka ETL processing). It’s a game-changer for us, providing a quick and easy way to transform data and incorporate it into our visuals.
Moreover, Power Query proves to be a handy tool for organisations without immediate access to a database. Take, for instance, our collaboration with a major medical supplies company. We used Power BI to directly connect to their CRM, Pipedrive, and transform data without the need for a separate database layer.
How Does Power BI Use Machine Learning?
Machine learning might seem like something out of a tech wizard’s toolkit, and in many ways, it is! Power BI harnesses this wizardry to empower users in uncovering patterns and making predictions from their data.
For instance, we’ve integrated Azure Machine Learning into Power BI to enrich reports with predictive models, enabling the detection of trends, anomalies, and correlations that might otherwise go unnoticed. It’s not just about understanding the present; it’s about foreseeing the future.
We’ve put this capability to work by constructing robust anomaly detection reports using machine learning for a prominent retailer. These reports shine a spotlight on any potentially suspicious consumer behaviour, ensuring proactive action can be taken.
Can Power BI be Integrated with Other Microsoft Tools?
Absolutely! In our toolkit, Power BI is the team player that seamlessly integrates with other Microsoft staples. Whether it’s pulling data from Excel, collaborating in Teams, or tapping into Azure’s cloud prowess, Power BI acts as the glue that brings all our data analysis efforts together in harmony. These integrations allow for a cohesive data analysis ecosystem within the Microsoft suite.
These integrations facilitate a seamless data analysis ecosystem within the Microsoft suite. We’ve collaborated with clients to seamlessly integrate Power BI with Microsoft Excel online, granting them the ability to directly update data within the dashboard, thereby empowering users with more control and flexibility.
How Does Power BI Contribute to Real-Time Data Analysis?
In the fast-paced world we navigate, ‘real-time’ isn’t just a buzzword – it’s a necessity. Power BI helps us deliver live dashboards that keep our fingers on the pulse. For our clients, this means being able to react instantly, with the latest data insights just a glance away. Ok, small confession – we usually strive towards a “near real-time” experience, meaning data refreshes and lags of anywhere between 15 minutes to 1 hour. Through our experience with clients, we’ve found this timeframe to strike an optimal balance, considering the tasks involved in achieving true real-time updates.
Regardless, near-real time data allows businesses to react promptly to changes and make informed decisions quickly. This can be set up using Power BI’s API or by connecting directly to supported data sources.
Relevant Projects at EdgeRed

At EdgeRed, we’ve leveraged the capabilities of Power BI across various projects to transform our clients’ data into actionable insights. Here’s a snapshot:
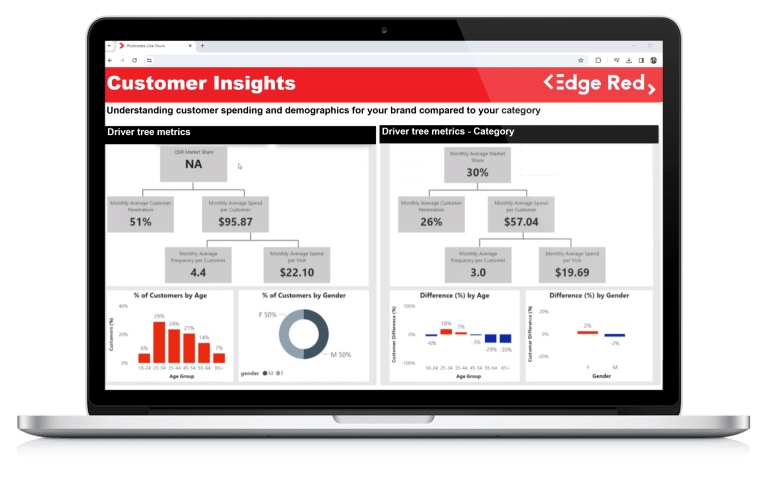
We revolutionised a client’s reporting system. What was once a static set of monthly reports is now an interactive, auto-refreshing Power BI dashboard. This dashboard not only tracks critical logistics metrics but also streamlines decision-making processes with its real-time data updates, which effectively eliminates the time-consuming task of manual report generation.
For a Human Resources department grappling with leave management, we developed a Power BI solution that automated the tracking of leave balances. This tool is directly linked with Microsoft SharePoint, allowing for instantaneous data updates and providing HR professionals with an accurate, real-time view of leave data. This has greatly simplified leave balance management and has provided clear, actionable insights to support workforce planning.
We also took on the challenge of simplifying a client’s sales reporting landscape for a major consumer services client. By consolidating a multitude of reports from various systems into a trio of well-organised Power BI dashboards, we not only saved significant time for analysts but also ensured that all stakeholders had access to consistent and current sales performance data. These dashboards, powered by Snowflake, supported near real-time data analysis and allowed for deeper drill-down into historical trends and performance metrics.
These examples are just the tip of the iceberg when it comes to how we harness the full potential of Power BI to make data work harder and smarter. For each of the projects, we bring industry best practices to enhance clarity, consistency, and effectiveness in presenting data.
About EdgeRed
EdgeRed is an Australian boutique consultancy specialising in data and analytics. We draw value and insights through data science and artificial intelligence to help companies make faster and smarter decisions.
Subscribe to our newsletter to receive our latest data analysis and reports directly to your inbox.


