Tips to improve your Tableau Dashboard performance
(part 2)
10 Sep 2024

In Part 1, we shared some foundational tips to boost your Tableau dashboard performance. Now, let’s dive into filters – a Tableau fundamental. When used incorrectly, filters can severely impact performance. In this part, we’ll walk you through how to apply filters effectively to keep your dashboards running smoothly and efficiently.
Use the right filter in the right place
There are various ways to use filters in Tableau, but they can impact performance if not used properly. To ensure your dashboard runs smoothly, you need to carefully consider how you apply filters. In this section, I’ve provided some tips to help you choose the right filters and optimise your dashboard’s performance.
Tip 1: Use filters in the right order

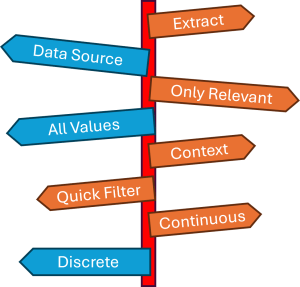
Extract Filters should be used first because they reduce the amount of data Tableau needs to handle right from the start. Data Source Filters come next to further refine the data at the connection level. Context Filters are used after to set a specific context for other filters, while Action Filters help with interactive features. Quick Filters, though helpful, should be used sparingly, as they can slow down performance if overused. Following this order helps keep your dashboard fast and efficient.
Tip 2: Avoid high-cardinality filters
Cardinality in a single column or field describes how many unique values it contains. Low cardinality means there are only a few distinct values, like in a field for employee type. High cardinality indicates many unique values, such as in a field for employee IDs.
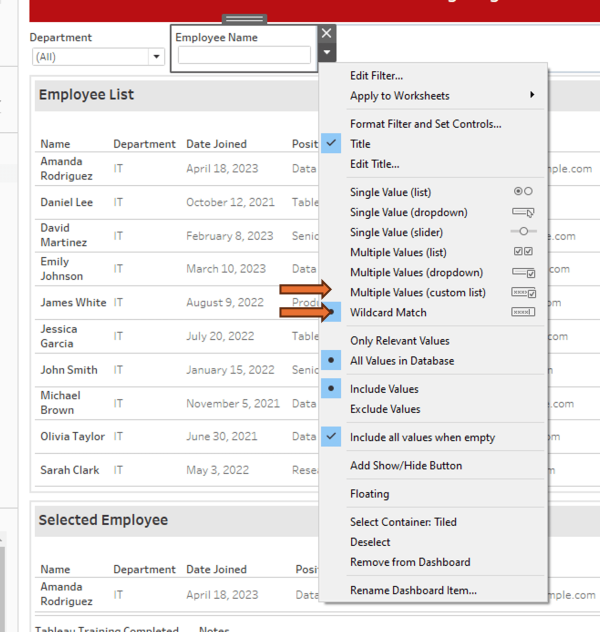
If you need a high cardinality quick filter on your dashboard, it’s best to use a “Multiple Values Custom List” or “Wildcard” filter.
The Multiple Values Custom List filter allows you to specify a custom set of values that users can select from. This approach can be more efficient than showing all possible values, specially in high cardinality scenarios, as it reduces the number of items displayed and processed at once.
The Wildcard Match filter lets you define a pattern to match a range of values. This can be particularly useful for high cardinality fields because it allows users to filter based on partial matches, rather than listing every single unique value. Both methods help manage performance by limiting the amount of data Tableau needs to handle at any given time, ensuring a more responsive and efficient dashboard experience.
Tip 3: Use all values in database
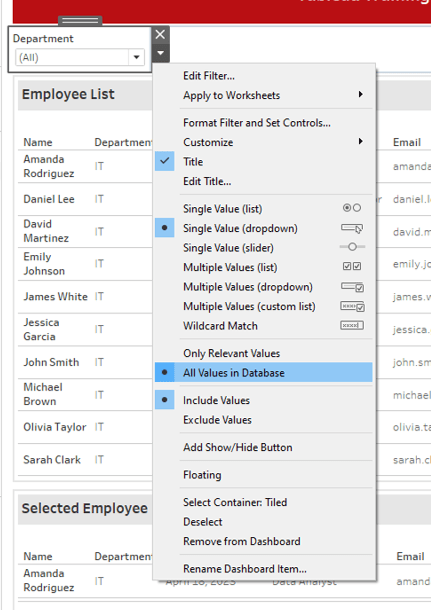
Choosing only relevant values in Tableau can reduce speed because it requires Tableau to constantly filter and process the data based on the criteria you specify. When you filter to show only certain values, Tableau has to evaluate these conditions in real-time, which can slow down performance, especially if the dataset is large or the filters are complex.
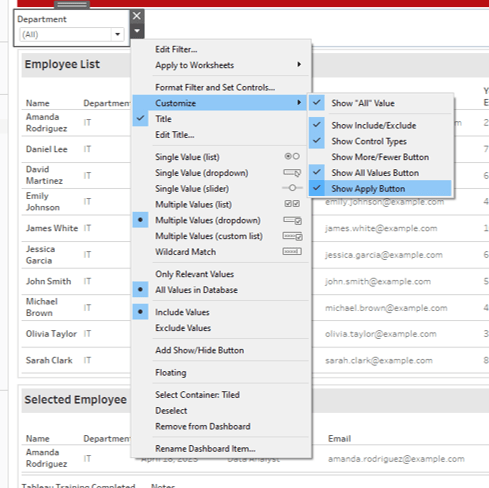
Tip 4: Use “Show Apply Button”
When the “Apply” button is used, Tableau waits until you click it to process and update the data based on your filter selections. This approach prevents Tableau from constantly recalculating and refreshing the dashboard with every change you make to the filter, which can be resource-intensive and slow down performance.
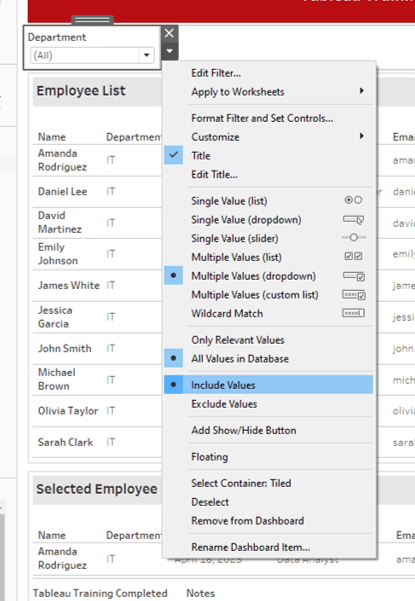
Tip 5: Avoid using “Exclude Values”
When you choose to exclude values in a filter, the query running behind the scenes is more complex compared to choosing to include values. This added complexity occurs because Tableau has to identify and remove a potentially large set of data that meets the exclusion criteria, which requires more processing power and time. As a result, exclusion filters can impact performance more than inclusion filters.
Tip 6: Use continuous date filter
Use a continuous date filter instead of a discrete one for better performance. Continuous date filters treat dates as a continuous range, which is more efficient for handling large datasets and detailed time analysis. Discrete date filters, on the other hand, manage each date as a separate category, which can slow down performance and increase processing time.
Tip 7: Use Integers, Numbers or Booleans instead of Strings
While it might not always be feasible to use integers or Booleans for all filters, it’s beneficial to use them whenever possible. Integers and Booleans are simpler data types that generally process more quickly and efficiently than complex string or date values. They require less computational power and memory, which can enhance the performance of your dashboard by speeding up query times and reducing load times.
Tip 8: Use action filters instead of quick filters
Use action filters instead of quick filters whenever possible for improved performance and user experience. Action filters are more efficient because they are triggered by specific user interactions, such as selecting an item in a visualisation, rather than applying a filter to the entire dataset continuously. This targeted approach reduces the amount of data Tableau needs to process at any given time, resulting in faster response times and smoother interactions.
Tip 9: Use context filters if helpful
When applying filters to a large data source, you might be able to improve performance by using context filters. A context filter creates a temporary table in the database, which can help filter the data more efficiently. However, success with this method may vary depending on the database and your permissions.
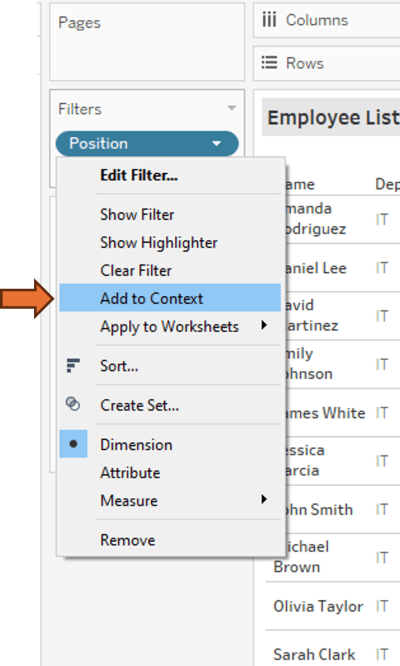
Keep in mind using one effective context filter to greatly reduce the data set size is more efficient than applying many context filters. If a filter doesn’t reduce the data set by at least 10%, adding it to the context can actually hurt performance due to the overhead. For more information and examples click here.
By fine-tuning your filters, you can significantly boost your Tableau dashboard’s performance. These strategies will keep your dashboards running smoothly – fast, responsive, and easy to use. Stay tuned for Part 3, where we’ll dive into advanced techniques to take your Tableau performance to the next level.
Catch up on our other parts:
This post was written by Nargess.
About the author
Nargess Kazemi is a seasoned data visualisation expert with a Master’s degree in Artificial Intelligence and a Bachelor’s degree in Mathematics. With her fine attention to detail and a penchant for crafting creative technical solutions, Nargess has been instrumental in developing robust algorithms and effective data visualisation dashboards that have been widely recognised and utilised by businesses. Her expertise in SQL, Python, and various data visualisation tools has contributed significantly to the success of our clients’ projects. When Nargess isn’t delving into data, she enjoys sharing her knowledge and mentoring fellow team members to foster a rich environment of learning and innovation at EdgeRed.
About EdgeRed
EdgeRed is an Australian boutique consultancy with expert data analytics and AI consultants in Sydney and Melbourne. We help businesses turn data into insights, driving faster and smarter decisions. Our team specialises in the modern data stack, using tools like Snowflake, dbt, Databricks, and Power BI to deliver scalable, seamless solutions. Whether you need augmented resources or full-scale execution, we’re here to support your team and unlock real business value.
Subscribe to our newsletter to receive our latest data analysis and reports directly to your inbox.


