The Story Behind NSW’s Top Schools: What Income Tells Us
2 Sep 2025
New South Wales (NSW) is a diverse state, with stark contrasts between its bustling urban centres and tranquil rural communities. One of the most fascinating aspects of this diversity lies in the interplay between household income and academic performance across the state’s suburbs.
This blog explores key themes in income distribution and academically strong areas within NSW, offering a closer look at how these factors intertwine.
The dataset used for household income comes from the Australian Census 2021, which provides a comprehensive snapshot of the socio-economic characteristics of Australian households. The data specifically focuses on median household income by postcode, which gives insight into the financial status of communities across NSW. For more details, you can access the dataset on the official Australian Bureau of Statistics website (Australian Bureau of Statistics, 2021).
On the academic front, the high school performance data comes from Better Education, a publicly available resource that ranks high schools based on the NSW Higher School Certificate (HSC) results of 2024. These rankings are based on the number of distinguished achievers, students who have attained results in the highest bands (Band 6 or Band E4) for one or more courses. This dataset provides a detailed look at the academic strength of various schools across the state. For further information, you can refer to Better Education’s HSC results page here.
DISCLAIMER – access to school data is limited (analysis is based on the top 10% NSW high schools covering 2024 HSC results and schools with principal permission).
Income Distribution Across NSW
The heatmap below reveals the annual median household income distribution across postcodes, offering a comparison of the financial landscape across various regions of the state.
The map uses a gradient colour scale, where lighter shade represents lower income areas and darker red shades indicate higher income earners. As the intensity of the colour deepens, it reflects an increase in the median income for households in those regions.
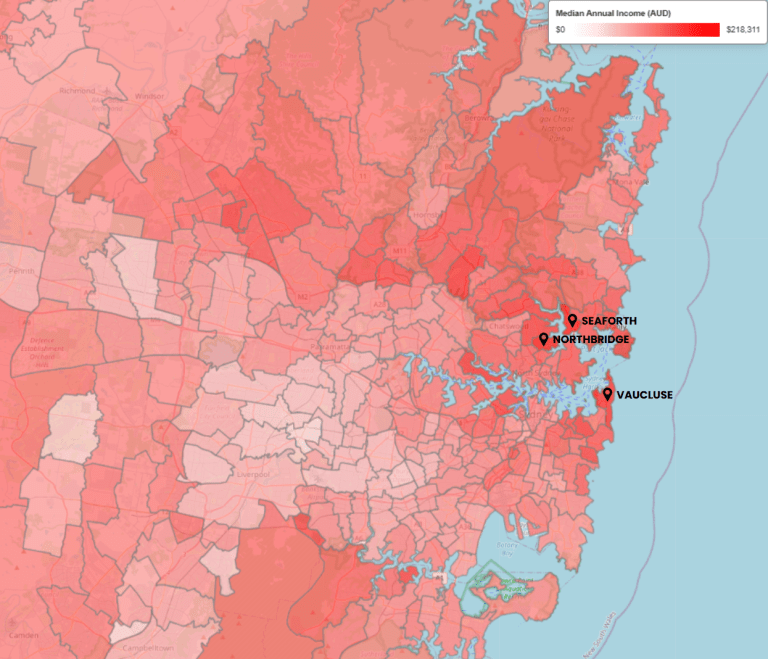
For instance, suburbs such as Seaforth, Northbridge, and Vaucluse are consistently among the highest-income areas.
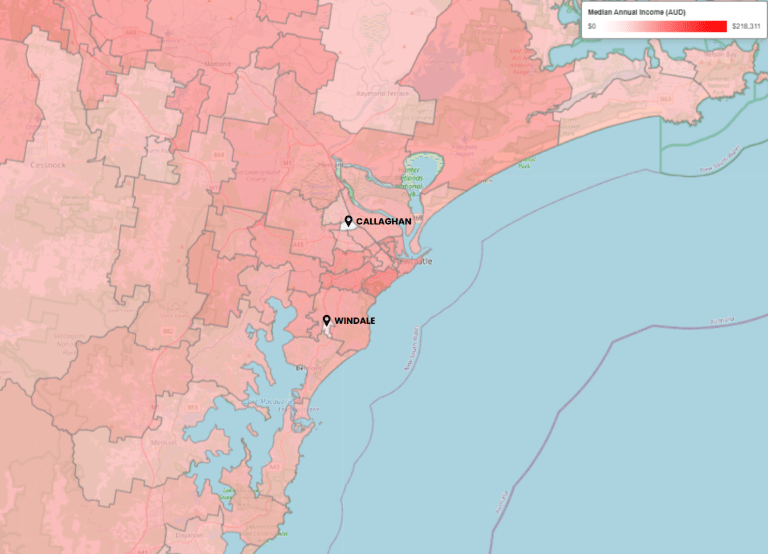
In contrast, areas such as Callaghan, Windale and parts of regional NSW experience lower household incomes. This significant disparity is an important backdrop when considering educational outcomes.
A Closer Look at HSC Performance and Geographic Trends
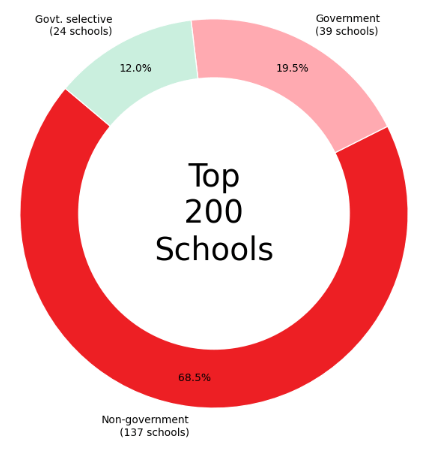
In NSW, academic performance is often gauged by key indicators such as HSC results, school rankings, and literacy and numeracy standards. We’ve compiled the top 200 high schools in NSW, ranked by the percentage of students achieving a Distinguished Achiever (DA) in the 2024 HSC exams.
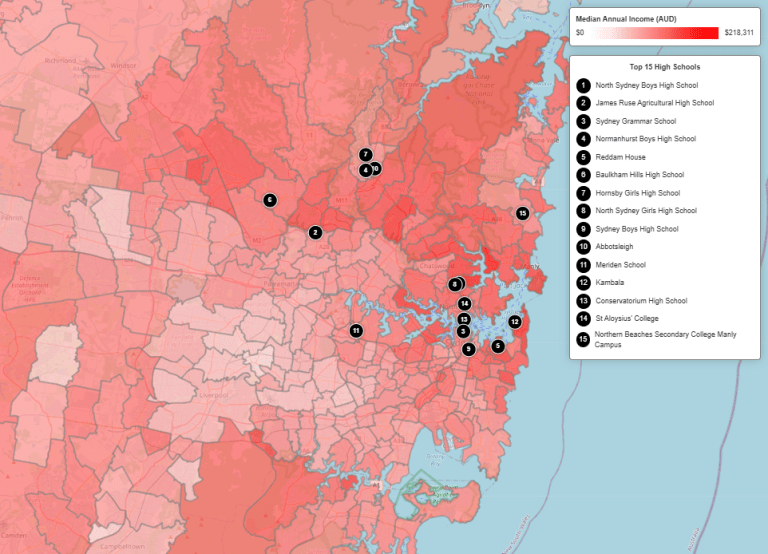
The above heatmap of the results reveals a striking trend: the top 15 high schools, comprising 8 selective schools, 6 non-government schools, and 1 government school, are all situated in NSW’s high-income suburbs, where the median household income exceeds $108,000.
If we further drill down this view specifically on the top 15 government high schools that only accept enrolments from their designated local areas, the pattern persists. 14 of these schools are located in affluent Sydney suburbs where the median household income exceeds $100,000.
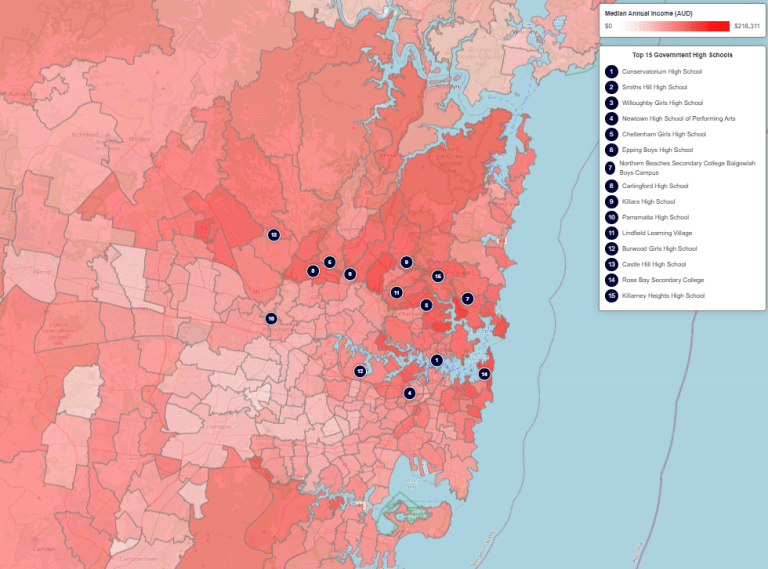
The exception, ranked as the second-best government high school, is located in Wollongong, NSW, an area with a relatively middle-class income, where the median household income is ~$85,000.
Socioeconomic Factors and Educational Outcomes
This trend raises important questions about the influence of socioeconomic factors on educational outcomes. Is the higher performance of government schools in affluent suburbs due to disproportionately greater funding and resources, or are there other factors at play?
Ever wondered how closely a neighborhood’s wallet relates to its academic success? This scatter plot is like a financial GPS for school performance, revealing a compelling truth: where we observe higher annual income, school performance tends to be better.
Each red dot represents a school, plotted against the median household income of its area. The upward sloping trend line tells a clear story – as household income rises, the school’s ranking tends to rise. It’s not just a graph; it’s a visual narrative of socioeconomic dynamics in education.
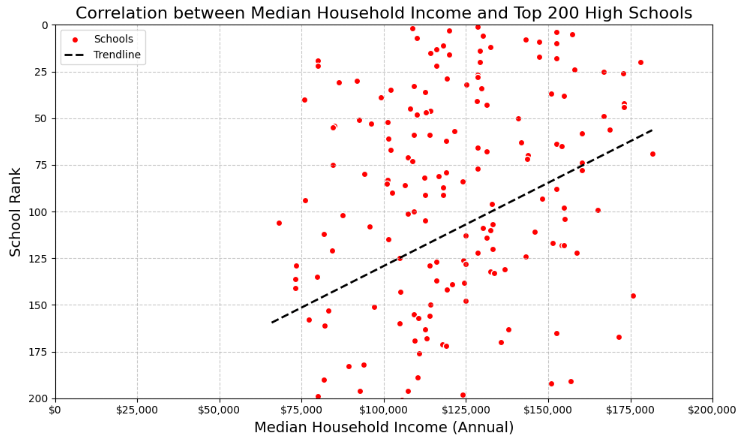
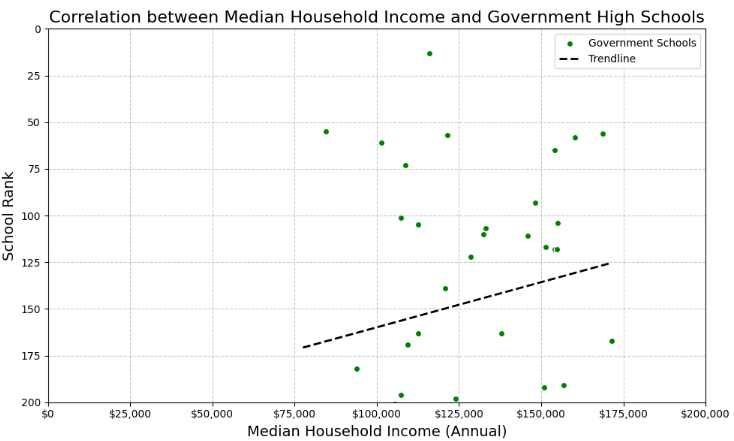
Some schools break the trend, of course – those rebel dots that defy expectations. But overall, the pattern is unmistakable: in this data landscape, prosperity and educational ranking dance a close, somewhat uncomfortable tango.
The role of Selective and Private Schools
Selective and private schools play a significant role in shaping the academic landscape of NSW. Selective schools in particular, are highly competitive, admitting students based on merit and extracurricular. However, preparation for entry exams is often supported by additional resources such as tutoring, which can be prohibitively expensive for lower-income families.
On the other hand, private schools often charge significant fees, further entrenching the divide between affluent and less-affluent communities.
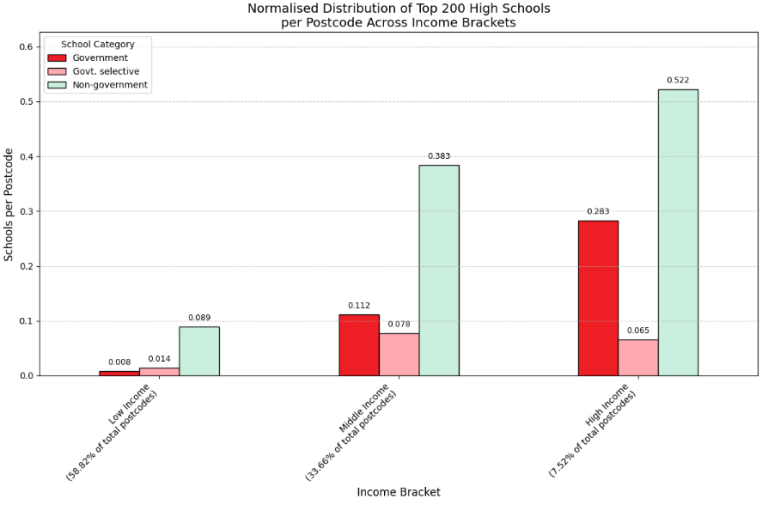
If you want a spot in one of NSW’s top high schools, your postcode matters a lot. This chart lays it out plainly: the higher the income bracket, the greater the concentration of elite schools. Low-income areas, despite making up the majority of postcodes, barely register on the map. Middle-income areas see a slight lift, but it’s in high-income postcodes where top schools, particularly private ones, truly dominate.
These income brackets are banded as follows:
- Low Income: Below $92,604.60 (lower 20% quintile)
- Middle Income: Between $92,604.60 and $143,759.40
- High Income: Above $143,759.40 (upper 20% quintile)
But these advantages extend beyond academics. Universities are increasingly looking for well-rounded students who show leadership, initiative and a commitment to their community. This means extracurricular activities sports, debating, volunteering, leadership programs and international experiences are playing a bigger role in university admissions.
For students in affluent areas, these opportunities are easy to come by. With access to elite programs, private coaching, and overseas study tours, they can build impressive resumes that stand out in competitive university applications. But for students in lower-income communities, financial barriers often limit participation in these activities, putting them at a disadvantage especially for highly competitive courses like medicine and law, where holistic assessments are common.
The postcode education gap doesn’t just affect high school rankings; it shapes future opportunities long before university applications even begin.
But what drives this geographic clustering of educational excellence? Part of the answer lies in schools varying capacity to attract top teaching talent through competitive compensation packages.
Teacher Wage Disparities Create Competitive Advantages
Recent government school pay increases saw starting salaries lift from $75,791 to $85,000 and top teacher salaries increase from $113,042 to $122,100 (Three-year award agreement accepted by NSW teachers). However, private school pay offers are seeing some teachers take home $180,000 pay packets that leave state schools struggling to compete. (Teacher salary gap widens as private school pay rises leave state school teachers behind – EducationDaily).
Private school teachers are now asking for 5–7% above their public colleagues, creating a significant wage premium that allows elite institutions to attract and retain the best educators. This competitive advantage is particularly pronounced in high-income areas where private schools can afford these premium salaries (Why are private school teachers paid more than their public colleagues?).
NSW’s teacher shortage doesn’t affect all schools equally. NSW public schools had an average casual teacher shortfall of 42% per day (Casual teacher shortage), with the crisis most acute in disadvantaged areas. Vacancies in regional, rural and remote NSW have dropped by almost 25%, from 1,241 at the start of school in 2023, to 938 in 2024 (More to do, but new figures show encouraging progress on teacher shortage | NSW Government), but these areas still face staffing challenges compared to affluent urban schools.
About 40% of principals reported an increase in pre-retirement resignations from teachers over the past year, with 18.5% moving to a private school (AEU : Filling critical teacher gaps). This teacher migration from public to private systems disproportionately benefits high-income areas where selective and private schools are concentrated.
The Compounding Effect? The combination of higher wages, better working conditions, and superior resources creates a virtuous cycle for schools in affluent areas. While public schools in disadvantaged communities struggle with teacher shortages and high turnover, selective and private schools in wealthy suburbs can maintain stable, experienced teaching staff who contribute to sustained academic excellence.
The Regional Divide in Educational Excellence
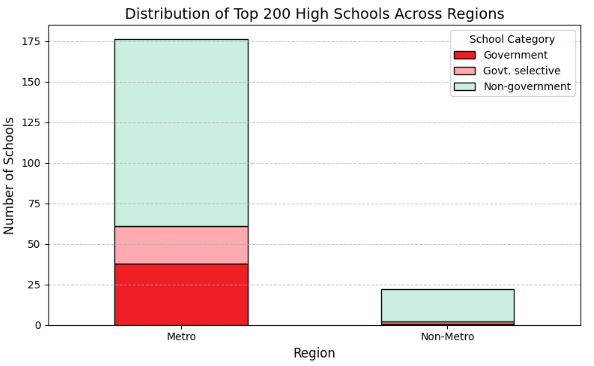
The data paints a picture of concentrated educational advantage in urban centers, with 176 top schools located in metropolitan areas. This includes 115 non-government schools, 23 selective schools, and 38 government schools – representing nearly 88% of the state’s top-performing institutions.
Regional areas account for only 20 schools in the top 200, all of which are non-government institutions. Even more concerning is the minimal representation from Inner Regional areas and virtually no presence in Outer Regional zones among top-performing schools.
Perhaps once again what is most notable is the complete absence of government schools outside metropolitan areas. While Sydney residents have access to 38 government schools among top performers, regional students have no equivalent options. This centralisation of selective education in urban areas potentially limits opportunities for academically gifted students in regional communities.
This highlights a critical challenge in educational policy ensuring that geographic location doesn’t determine educational opportunities. While some regional schools demonstrate that excellence is possible outside metropolitan areas, the data suggests more evidence towards a systematic imbalance in the distribution of educational resources and opportunities between urban and regional communities.
Decade of Change – Average School Rankings from 2014 to 2024 by Income Brackets
This chart highlights a tough reality: while schools in high and middle income areas have either maintained or slightly improved their rankings over the past decade, those in low income areas have suffered a significant decline. It’s a clear sign that disadvantage isn’t just persistent; it’s getting worse.
Education and income are deeply correlated. Studies show that higher income families can invest more in their children’s education whether through access to top schools, tutoring, extracurricular programs, or simply a home environment that fosters learning. This advantage compounds over time, leading to better academic performance, higher university enrolment rates, and ultimately, greater lifetime earnings. In contrast, lower income families often face systemic barriers, underfunded schools, fewer resources, and limited academic support, creating a cycle where disadvantage becomes entrenched.
A report from the Urban Institute highlights that wealth disparity and education disparity go hand in hand: “The financial resources available to families significantly impact educational outcomes, reinforcing economic inequality across generations.” Without targeted interventions such as increased funding for disadvantaged schools, equity-driven education policies, and broader economic reforms the trend shown in this chart will only continue. If we want to bridge the gap in academic success, we must first address the deeper issue: the growing divide in wealth and opportunity.
In Conclusion
The analysis of income distribution and academic performance in New South Wales paints a clear picture of how socio-economic factors shape educational opportunities. It’s evident that wealthier suburbs, particularly in metropolitan areas, are better equipped with high-performing schools, including selective and private institutions, which offer a wider range of resources and extracurricular opportunities. In contrast, lower-income and regional areas face significant educational challenges, with fewer top-performing schools and a noticeable lack of selective options.
This divide isn’t just a reflection of geographical differences; it’s a stark reminder that access to quality education in NSW is closely tied to one’s economic standing. The concentration of educational excellence in wealthier areas, coupled with the absence of such opportunities in less affluent regions, highlights the need for ongoing attention to this disparity. While some may argue that academic success is shaped by individual effort and resilience, the data suggests that location and income still play a defining role in shaping a student’s educational journey.
The journey from suburban Sydney to rural NSW may be a physical one, but for many students, it also represents a divide in opportunity, one that requires careful consideration and action as we look to the future of education in the state.
This post was written by Raveena.
About EdgeRed
EdgeRed is an Australian boutique consultancy with expert data analytics and AI consultants in Sydney and Melbourne. We help businesses turn data into insights, driving faster and smarter decisions. Our team specialises in the modern data stack, using tools like Snowflake, dbt, Databricks, and Power BI to deliver scalable, seamless solutions. Whether you need augmented resources or full-scale execution, we’re here to support your team and unlock real business value.
Subscribe to our newsletter to receive our latest data analysis and reports directly to your inbox.