Tips to improve your Tableau Dashboard performance
(part 1)
3 Sep 2024

Tableau is a powerful tool for visualising and analysing data, but as your datasets grow and dashboards become more complex, performance can sometimes take a hit. Keeping your dashboards running smoothly is crucial for delivering a seamless and efficient user experience.
In this three-part series, we’ll dive into practical tips and strategies to supercharge your Tableau dashboard performance, starting with the basics in Part 1. Let’s dive in!
Tip 1. Perform transformations and calculations in the database
Whenever possible, handle calculations directly in the database to minimise processing overhead in Tableau. This approach improves performance by leveraging the database’s optimised computation capabilities and reduces the load on Tableau, allowing for faster and more efficient data visualisations.
Tip 2. Avoid Custom SQL
Using Custom SQL can impact performance negatively because it bypasses Tableau’s query optimisation. Instead, use Tableau’s native data connectors and let Tableau optimise the queries.
Here’s how to avoid custom SQL:
Import only the data you need.
Avoid using SELECT *; instead, drag specific tables into the canvas.
Perform joins, relationships, unions, and filtering through Tableau rather than writing a custom SQL.
If you must use custom SQL, try to avoid including an ORDER BY clause.
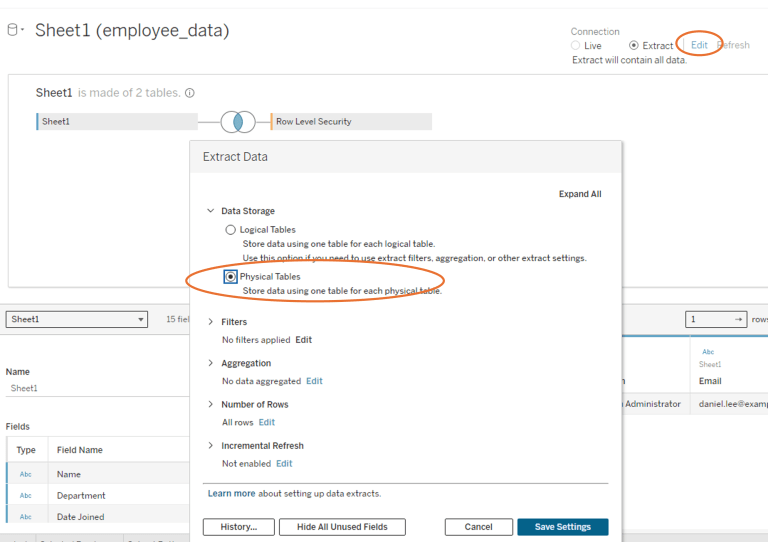
Tip 3. Use Extracts
Extracts are a fast and simple method to improve performance if you don’t need real-time data. You can schedule extracts to refresh periodically to ensure data currency.
Tip 4. Use physical joins when combining data sources
Use physical joins rather than logical joins when joining two tables. Physical joins execute faster because they reduce the amount of data transferred between the database and Tableau.
Tip 5. KISS (Keep it simple, stupid)
Limit number of worksheets: Too many charts or too much data on a dashboard will cause poor performance. Allow your users to incrementally drill down to details, rather than trying to show everything at once. This is called guided analysis.
Only work with the data you actually need. This means minimizing both the fields you reference and the level of detail in the records you retrieve.
Fix dashboard size: Set a fixed dashboard size based on how end-users will view it, as automatic sizing is often less efficient than a fixed size dashboards.
By putting these strategies into action, you’ll give your Tableau dashboards a serious performance boost, making sure your users enjoy fast, responsive, and efficient data visualisations.
Stay tuned for Part 2 of our top Tableau tips!
This post was written by Nargess.
About the author
Nargess Kazemi is a seasoned data visualisation expert with a Master’s degree in Artificial Intelligence and a Bachelor’s degree in Mathematics. With her fine attention to detail and a penchant for crafting creative technical solutions, Nargess has been instrumental in developing robust algorithms and effective data visualisation dashboards that have been widely recognised and utilised by businesses. Her expertise in SQL, Python, and various data visualisation tools has contributed significantly to the success of our clients’ projects. When Nargess isn’t delving into data, she enjoys sharing her knowledge and mentoring fellow team members to foster a rich environment of learning and innovation at EdgeRed.
About EdgeRed
EdgeRed is an Australian boutique consultancy with expert data analytics and AI consultants in Sydney and Melbourne. We help businesses turn data into insights, driving faster and smarter decisions. Our team specialises in the modern data stack, using tools like Snowflake, dbt, Databricks, and Power BI to deliver scalable, seamless solutions. Whether you need augmented resources or full-scale execution, we’re here to support your team and unlock real business value.
Subscribe to our newsletter to receive our latest data analysis and reports directly to your inbox.