Only the loyal will survive:
How survival analysis can be used to promote customer loyalty and retention
17 Jun 2024

In today’s competitive business environment, keeping customers loyal is critical for survival. But how do you know which ones are at risk of churning, and when?
Traditional churn models can tell you if a customer is likely to churn, but they don’t tell you the whole story. They can’t tell you when a customer is likely to churn. This is where survival analysis comes in.
Survival Analysis: Predicting when, not just if
Survival analysis is a statistical technique that’s more commonly used in fields like medicine to study how long it takes for patients to recover from an illness. But it turns out to be just as useful for businesses that want to understand customer lifespans (retention).
Here’s how it works: Instead of focusing on a yes/no churn prediction, survival analysis looks at the time it takes for a customer to churn.
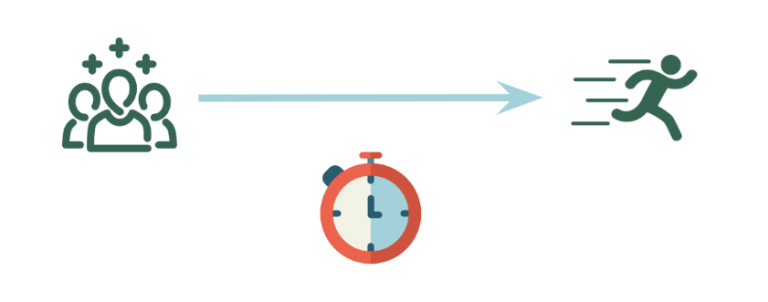
This allows you to identify periods of high churn risk and understand what factors contribute to churn at different points in the customer lifecycle.
How can we visualise survival?
We already established that survival analysis goes beyond the typical “will they churn” question. It delves into the “when” aspect, predicting the timeframe a customer might churn. But how exactly does it achieve this? Let’s explore two of the most popular methods:
1. Kaplan-Meier Curve: a visual timeline of churn
The Kaplan-Meier curve is a powerful tool that creates a visual story and understanding for overall churn patterns. Here’s the gist:
It uses customer data, including their churn time (if they churned) or the current date (for those who haven’t).
It calculates the probability of survival at each time interval, considering both churned and non-churned customers.
The resulting curve depicts the likelihood of a customer lasting with your business over time.
Consider a telecom company’s customer data. Over time, some inevitably churn. But for how long do they stay? What is their retention rate?
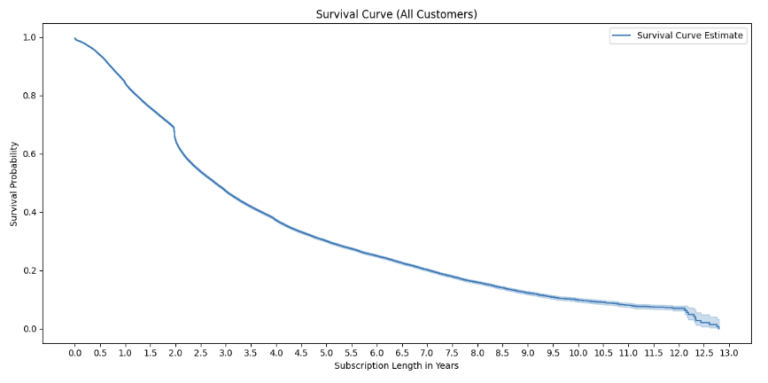
For instance, the survival curve dips slightly at the one-year mark and then takes a bigger dive at two years. Knowing that many contracts are for one or two years, this suggests a connection: customers on expiring contracts are likely not renewing.
The curve highlights that the survival rate is 84% at the one-year mark. This means that if a customer has been with you for a year, there’s an 84% chance they’ll stay on as a customer. By the two-year mark, that probability drops to 65%, and at three years it’s only 47%. Looking at this data another way, we can say the median survival time is about 2 years and 9 months. In other words, if a customer has been with your business for that long, then after this point, there’s only a 50/50 chance a customer will remain with you.
By understanding your customer survival curve, you can identify areas for improvement and make data-driven decisions to keep your customers happy and on board for the long haul.
2. Cox Proportional Hazards Model: the “Why” behind the “When”
The Kaplan-Meier Curve tells us the survival probability over time, but what factors influence the risk of churning? This is where the Cox proportional hazards model comes in.
Think of it as a regression analysis for survival data. It helps you identify characteristics (like purchase history) that increase or decrease the risk of churn at specific points in the customer lifecycle.
For example, the model might reveal that customers who haven’t made a purchase in the last three months have a higher risk of churning soon. This actionable insight allows you to target these at-risk customers with win-back campaigns or loyalty programs.
By combining the visualisation of the Kaplan-Meier Curve with the explanatory power of the Cox model, you gain a comprehensive understanding of customer churn. You can not only predict when churn might occur but also identify the factors driving it at different stages of the customer journey.
The power of Survival Analysis: a telecom case study
Imagine you’re a telecom company battling against churn. You know some customers leave after a year, while others stay loyal for years. But why? Survival analysis can help you shed light on these mysteries.
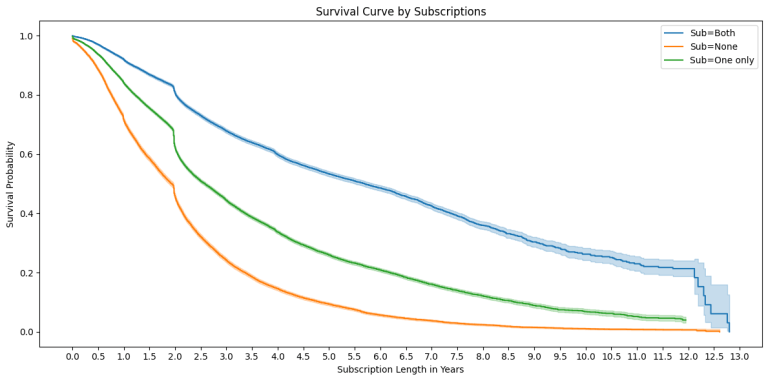
By analysing customer data, including subscription plans, add-on packages, and download habits, you can uncover hidden patterns. For instance, the case study revealed that customers who subscribed to both TV and movie packages had a higher survival rate than those who subscribed to only one or none. This suggests that offering bundled packages could be an effective strategy to reduce churn.
Survival Analysis vs traditional Churn Modelling
Traditional churn models are like basic smoke detectors: they alert you to the presence of a fire but don’t provide much detail about its origin or severity. More advanced techniques, like using a random forest model, can act like enhanced smoke detectors with indicators showing the likely causes of the fire through feature importance charts. However, survival analysis goes a step further—it’s akin to a sophisticated fire alarm system with zones. It not only alerts you to the fire but also pinpoints its location and predicts its potential spread, enabling you to take precise, targeted action to extinguish the flames.
Survival analysis goes beyond identifying high-risk churn periods. It also helps you pinpoint the root causes of churn at different stages of the customer lifecycle.
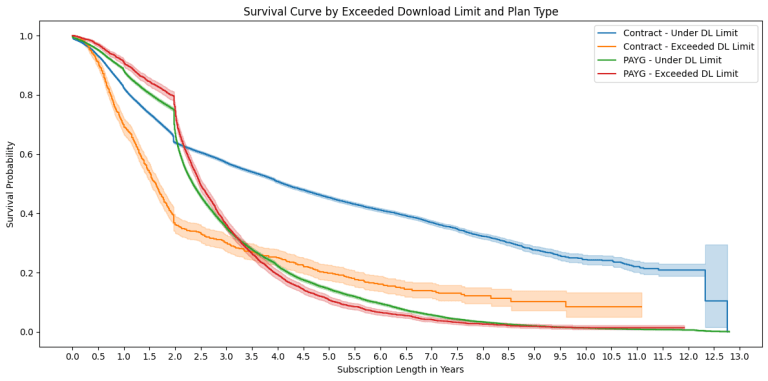
In the telecom case study, researchers found that customers who exceeded their download limits and were on fixed-term contracts were more likely to churn after their contracts expired. This suggests a feeling of frustration among these customers. They’re likely exceeding limits because their current plan doesn’t meet their needs, yet they’re still locked into a contract and incurring additional fees for exceeding those limits. These fixed costs combined with excess data charges – could be driving customer churn. Offering these customers higher download limits, more flexible plans, or even prorated data packages could improve retention.
The takeaway: keep your customers loyal
By understanding customer lifespans and the factors that influence them, you can develop targeted strategies to improve customer loyalty.
Here are some key takeaways from the case study:
Identify high-risk churn periods: Survival analysis can help you pinpoint periods when customers are more likely to churn. This allows you to be proactive and launch targeted retention campaigns during these critical times.
Uncover hidden patterns: By analysing customer data, you can discover factors that contribute to churn at different stages of the customer lifecycle which you may not be aware of.
Develop targeted strategies: Using insights from the survival analysis, you can develop targeted retention campaigns or product offerings to address the specific needs and concerns of at-risk customers.
Want to Dive Deeper? DOWNLOAD OUR WHITEPAPER
This blog post has just scratched the surface of survival analysis and its applications in customer churn reduction. If you’d like to learn more about the specific methods used in the telecom case study, refer to the full white paper.
Frequently Asked Questions (FAQ)
Survival analysis is a statistical technique commonly used to analyse the time until an event of interest occurs. In the context of business and customer retention, it helps predict when customers are likely to churn, rather than just whether they will churn. This insight is crucial for developing proactive strategies to enhance customer loyalty.
Traditional churn models provide binary predictions (churn or not churn), whereas survival analysis goes further by predicting the timing of churn events. This enables businesses to identify specific periods when customers are at high risk of leaving and to understand the factors influencing churn at different stages of the customer lifecycle.
The Cox model is a statistical technique that helps identify factors influencing the risk of churn at different stages of the customer journey. It provides insights into why customers churn by analyzing variables such as purchase history or service usage patterns. This information allows businesses to tailor retention strategies more effectively.
This blog was written by David.
About EdgeRed
EdgeRed is an Australian boutique consultancy specialising in data and analytics. We draw value and insights through data science and artificial intelligence to help companies make faster and smarter decisions.
Subscribe to our newsletter to receive our latest data analysis and reports directly to your inbox.


