Google Looker Studio: How to Optimise Speed
14 Nov 2024

Google Looker Studio, formerly known as Google Data Studio, is a powerful business intelligence tool that enables users to create interactive, shareable reports and dashboards. With its ability to connect to various data sources, it allows for visualising data through customizable charts, graphs, and tables. However, performance issues can arise, often caused by inefficient data preparation, large or complex data sources, and heavy calculations or data blending within Looker Studio. Optimising performance is crucial for a smooth and efficient reporting experience.
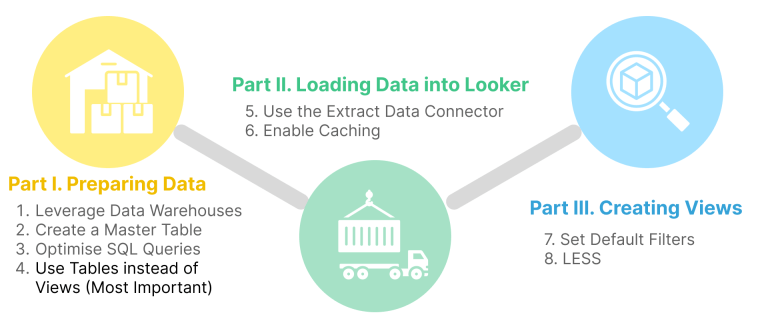
In this post, we’ll provide 8 practical tips to speed up your Looker Studio reports, broken down into three key areas: preparing data, loading data into Looker, and creating views. These tips will help you minimise bottlenecks and ensure faster load times, making your reporting experience more efficient!
Part 1. Preparing Data
For those who have experience building dashboards, you’ll know that the first step isn’t to jump into the dashboard software and start creating visuals. Instead, it’s crucial to prepare your data beforehand. The way you structure and manage your data can significantly impact the speed and performance of your Looker Studio reports.
Tip 1. Leverage Data Warehouses to Optimise Data Sources
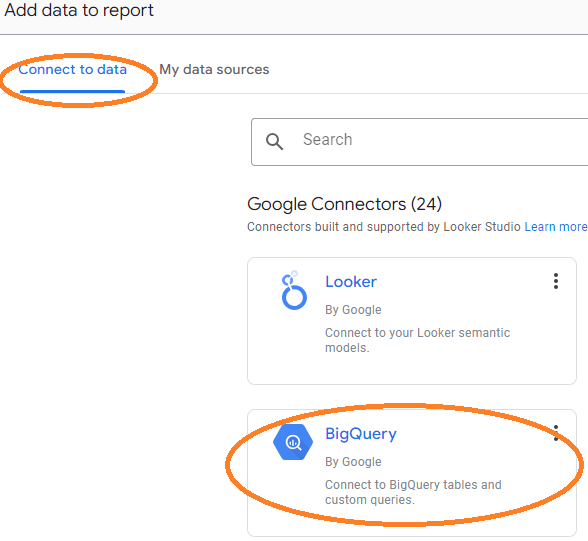
Just like organising a shoe rack, you wouldn’t want shoes scattered around the house—under the sofa or on the bed. Similarly, your data should be consolidated and well-organised for easier analysis. Reducing the number of data sources can streamline report performance. Using optimised data sources specifically designed for reporting is essential. For large datasets, consider leveraging data warehouses like Google BigQuery or Snowflake, allowing Looker Studio to access your data quickly and efficiently from a centralised location.
For example, if you have sales data stored in multiple spreadsheets, consolidate it into a single data warehouse like BigQuery to improve performance and ease of analysis.
Tip 2. Create a Master Table to Avoid Calculations and Blending in Looker
Now that your data is consolidated in one place, it’s important to organise it into a single, well-structured table to make it easier for Looker Studio to access. Excessive calculated fields and blending multiple datasets within Looker can significantly slow down your reports.
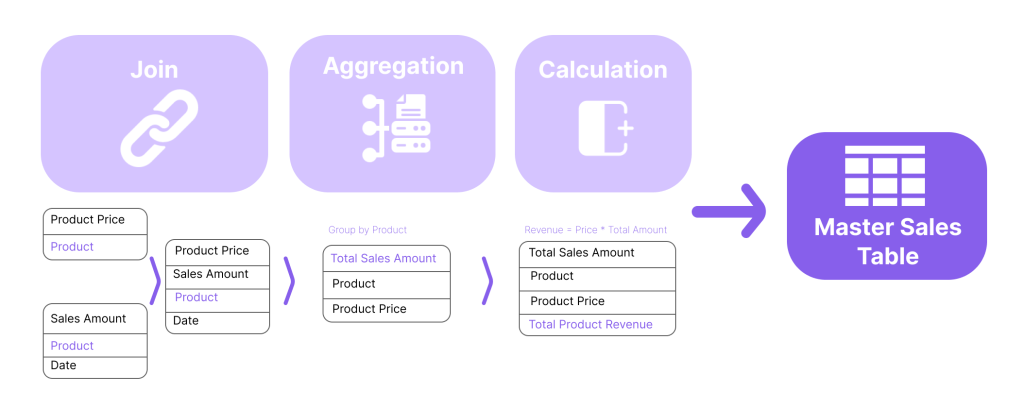
This is why it’s crucial to join, aggregate, and perform necessary calculations beforehand. By using key columns to join datasets, you can create a single master table to upload into Looker Studio. This not only improves performance but also simplifies applying filters when building visuals.
Additionally, pre-aggregating your data before uploading it can drastically enhance performance and reduce costs. By grouping and aggregating data at the source, rather than pulling in detailed records, you can reduce the data size and speed up loading times.
Finally, be clear about what data you need before building visuals. When performing calculations, consider creating a new column for these values, rather than relying on real-time calculations in Looker Studio.
For example, as shown in the infographic, you can use key columns like Product to join datasets and aggregate the data by grouping it by Product, allowing you to get the Total Sales Amount over time. If you’re calculating Total Product Revenue, you can pre-calculate it by multiplying Price by Total Amount in your master table, rather than having Looker Studio perform the calculation on the fly.
Tip 3. Optimise SQL Queries to Reduce Processing Time
How can we implement joins, aggregations, and calculations efficiently in the backend? In most data warehouses, data consolidation is typically performed using SQL. Here are some tips to help you speed up the process by using the appropriate calculation syntax in SQL:
Instead of using SELECT *, specify only the columns you need.
Use LIMIT to restrict the number of rows returned.
Use WHERE to filter data as early as possible in your query to minimise the data processed.
Use GROUP BY and aggregate functions (like SUM, AVG) to reduce data size before it reaches Looker Studio.
Avoid using SELECT DISTINCT or ORDER BY unless necessary, as they can increase processing time.
Use materialised views for frequently accessed queries. These store the results of a query and update automatically, improving performance for repeated queries.
Tip 4. Use Tables instead of Views to Minimise Loading Time (Most Important)

The speed of your reports can be significantly improved by pulling data from a static table instead of querying a live data source (view) each time. By creating a static copy of your data (a table), Looker Studio will use the pre-extracted data, which greatly reduces the time required to load your report.
For example, when using BigQuery, consider converting your view into a table. This can be done by creating a table from the view in BigQuery and scheduling the query to update as needed. Once the table is created, connect it to Looker Studio. If you already have a connection to the view, you can simply update Looker Studio to use the new table, ensuring faster performance.
Part 2. Loading Data into Looker
Now that the data is ready, we can close the data warehouse pages and focus on how to improve Looker Studio performance during the data loading process. These tips will be applied within the Looker Studio interface.
Tip 5. Use the Extract Data Connector to Create Static Datasets
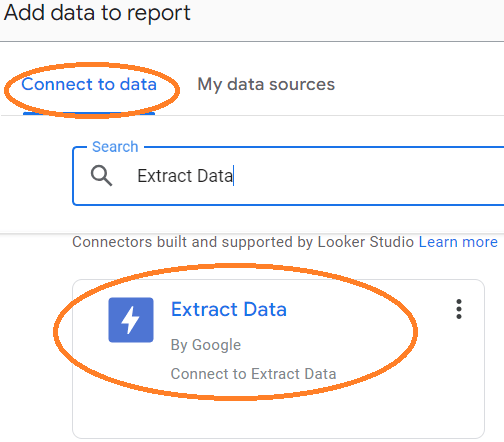
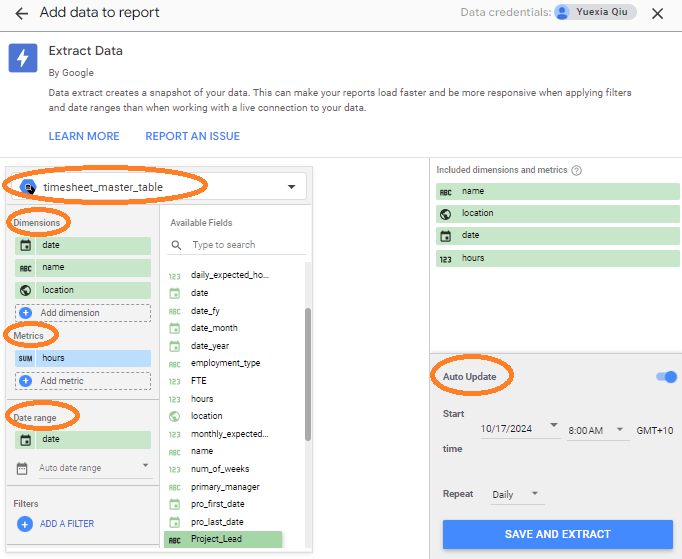
Another way to create static data is by using the Extract Data Connector in Looker Studio. This feature allows you to create a snapshot of your data, which can significantly improve performance and simplify reporting. It pulls data from your original source and creates a static copy, meaning that instead of querying the live data source every time you load your report, Looker Studio will use the extracted data.
Click the “Add Data” button (the “+” icon)
Search for “Extract Data” / select it from Google Connectors
Choose an existing table from the data source
Select dimensions and metrics
Define the data range
(Optional) Enable auto-update
Tip 6. Enable Caching to Reduce Repeated Data Fetching
Enable caching for your reports to speed up loading times for frequently accessed data.
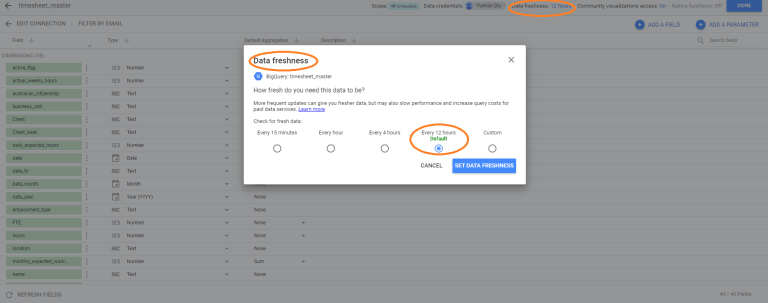
In Looker Studio settings, configure the caching duration to hold data for a day, reducing the need for repeated data fetching.
Click the “Resource” menu at the top
Select “Manage added data sources” to view linked sources
Click the pencil icon next to the data source to edit
Find the “Data Freshness” section in the settings
Set the refresh interval to 12 hours
After adjustments, click “Set data freshness”
Note:
For dynamic data, shorter intervals may be necessary, while static data can tolerate longer refresh times.
Monitor the performance of your report before and after adjusting the Data Freshness setting to ensure it meets your expectations.
Part 3. Creating Views
Finally, we can create the views in Looker Studio. Here are two tips on how to optimise performance during this step.
Tip 7. Set Default Filters to Decrease Processing Time
To enhance efficiency, it’s important to set default filters when creating your views. One way to do this is by selecting a shorter data range, such as “Last week” or “Last month.” Broader ranges, like “Last quarter” or “Last year,” require Looker Studio to load and process a much larger volume of data, which can significantly increase processing time. By narrowing the data range, you can reduce the amount of data being processed and speed up your report’s performance.
Tip 8. LESS (Limit Elements for Streamlined Success)
Reduce dashboard complexity by minimising the number of charts or splitting charts or graphs into multiple pages.
Minimise the use of filters, data blending, and custom calculations, as blending is often a primary contributor to performance issues.
Final Thoughts
Optimising performance in Google Looker Studio is crucial for creating reports that are both efficient and responsive. By focusing on a few key strategies, such as aggregated data, enabling caching, optimising SQL queries, or reducing dashboard complexity – you can significantly enhance your data visualisation experience.
Implementing these good practices not only boosts loading times but also ensures a smoother, more productive interaction with your visualisations. There are several approaches to optimising speed in Google Looker Studio, and these strategies can serve as effective practices that may help you achieve that goal.
If you need assistance or have any questions about optimising your reports in Google Looker Studio, don’t hesitate to reach out to us. We’re here to help you get the most out of your data visualisation experience!
This blog was written by Yiying and Yuexia.
About EdgeRed
EdgeRed is an Australian boutique consultancy with expert data analytics and AI consultants in Sydney and Melbourne. We help businesses turn data into insights, driving faster and smarter decisions. Our team specialises in the modern data stack, using tools like Snowflake, dbt, Databricks, and Power BI to deliver scalable, seamless solutions. Whether you need augmented resources or full-scale execution, we’re here to support your team and unlock real business value.
Subscribe to our newsletter to receive our latest data analysis and reports directly to your inbox.


