Utilising Google Forms to collect input from Tableau users
9 Jul 2024

When designing a Tableau dashboard, we usually concentrate on showing data to users, however, sometimes we also need to ask users for their input. Tableau is a great tool to visualise and present the data, yet options are limited when it comes to retreiving input from the users.
In this post, I’ll demonstrate with a simple example how you can use Google Forms to collect user inputs directly within a Tableau dashboard.
Integrating Google Forms with Tableau – Step by Step
Imagine we have a table listing employees along with their Tableau training status. The admin relies on this dashboard to monitor the status and also needs a way to update it when necessary.
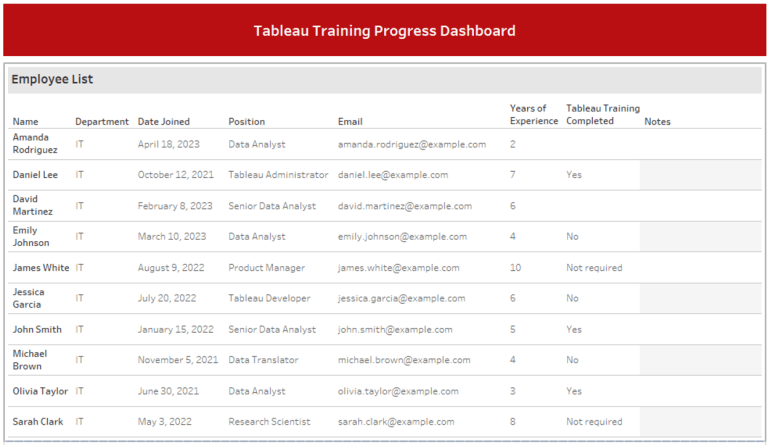
We’ll add a section into the dashboard where users can input their data and submit it to a connected Google Form seamlessly.

Alright, let’s dive in and start building!
Step 1: Set up a Google Form
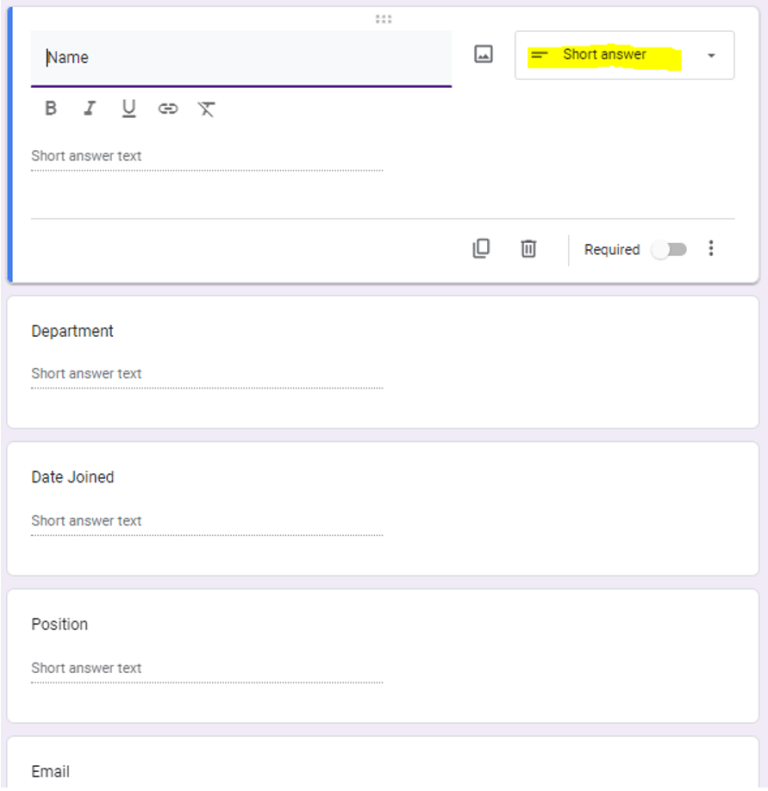
Set up a Google Form by using the column names as the form fields. For our example the fields will be Name, Department, Date joined, Position, Email, Years of Experience, Tableau Training Completed and Notes. You can also include an extra field called ‘Username’ to capture the name of the user submitting the value. Before I forget, please select the ‘Short answer’ option for the question types.
Step 2: Get the form link
Click on the three dots next to your profile, then select ‘Get pre-filled link’.

Fill the form with any values you like. I typically copy and paste the column name as the value. Once you reach the bottom, click on ‘Get link’ and then ‘COPY LINK’.

Paste the link in a notepad and save it. Next, we need to replace the phrase ‘viewform?usp‘ with ‘formResponse?ifq‘ in the link.
Step 3: Create a worksheet for the selected employee
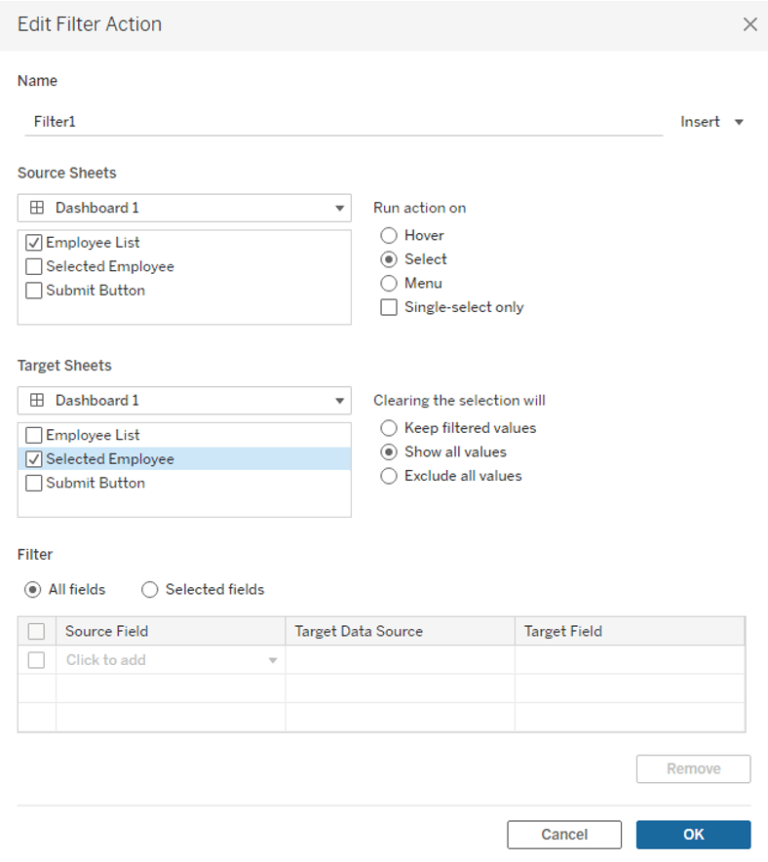
Duplicate the employee list sheet. Name this new sheet ‘Selected Employee’. Drag the ‘Selected Employee’ sheet to the dashboard. Then, create an action filter with the following options.
Step 4: Create the submit button
Duplicate the employee list sheet once again. This time, name it ‘Submit Button’. In the sheet select all columns and drag them to details. Drag Phrase “Submit” or any other word you prefer to label. Also, switch ‘Automatic’ to ‘Square’ and pick a colour for the background to make it look more like a button.
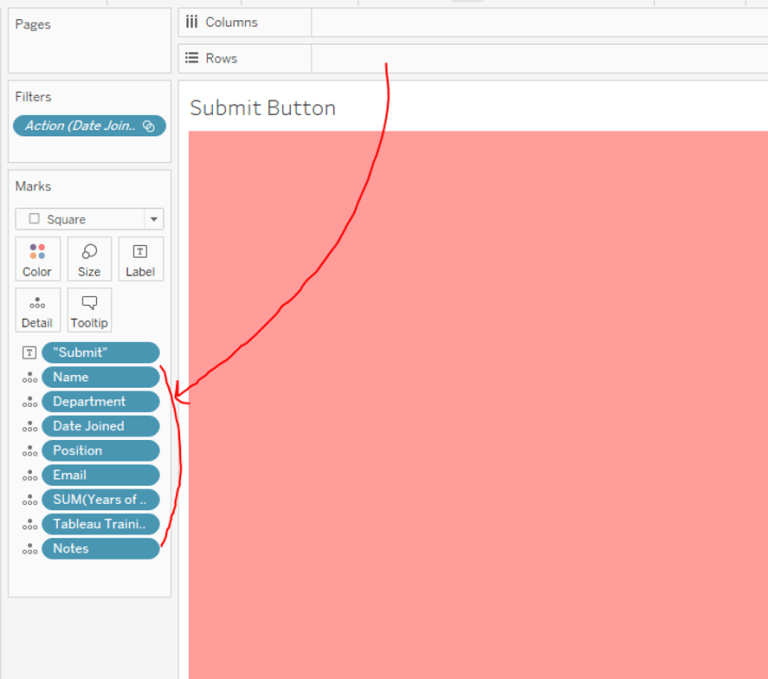
Drag the ‘Submit Button’ sheet to the dashboard. Then, modify the action filter (Filter1) and select the ‘Submit Button’ sheet.

Step 5: Create parameters for input
In this step, we set up parameters to gather input from the user. For this example, we require two parameters: one for training status and another for notes.

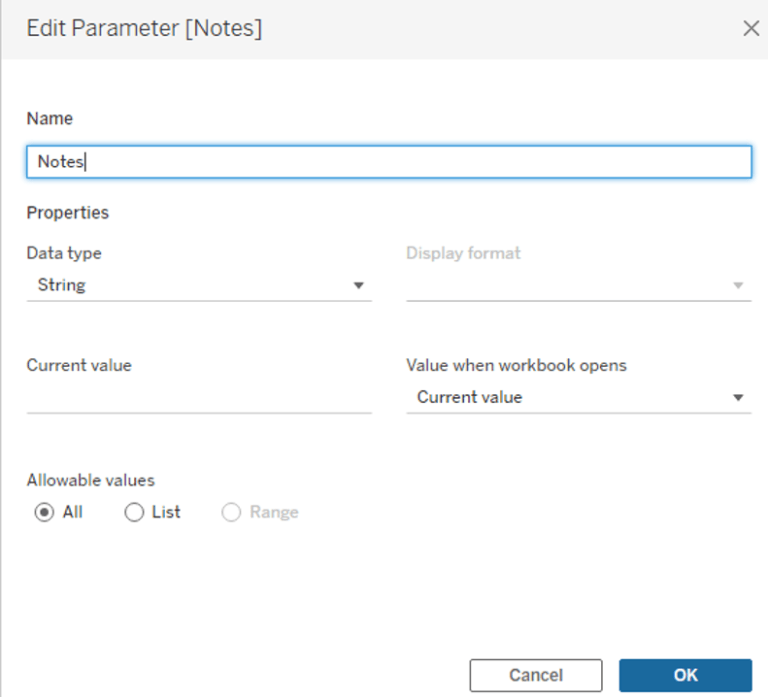
Step 6: Link the dashboard to the form
Now, we need to create a ‘Go to URL’ action for the submit button. Begin by selecting the ‘Submit Button’ as the source sheet. Choose ‘Select’ as Run action on. In the URL section of creating the action, simply paste the URL we saved and modified in step 2.

Before hitting ok, we have to replace all the question titles with their corresponding Column or parameter in the link. I have highlighted all the sections that require replacement in this example.


After you’ve replaced all the columns, click ‘OK’. Then, on the dashboard, choose a person and their training status. You can add notes if you want, then click ‘Submit’! Now, when you go to the response tab, ‘View in Sheets’ in your Google Form, you’ll see the row you just submitted!

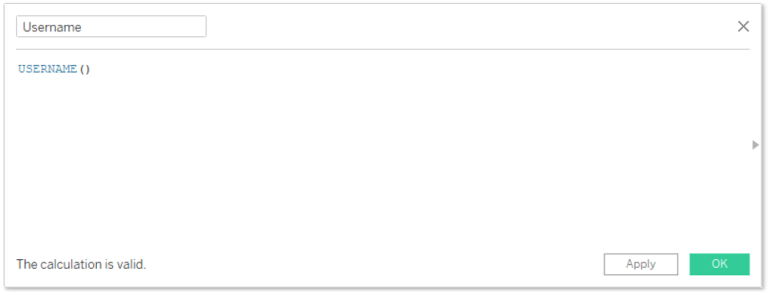
Notes: To capture the username, use Tableau’s built-in function USERNAME(). Create a calculated field with this formula and name the calculated field appropriately, such as ‘Username’.
Step 7: Adjust the form’s access settings
Finally, ensure the form response is accessible to those who need to submit data from the dashboard. In the form created in step 1, navigate to the Responses tab, then click ‘View in Sheets’.

In the response sheet, click ‘Share’ and adjust the sharing settings to allow access for anyone who will use the form or modify the general access to be less restricted.

Conclusion
That’s it! We hope you found this tutorial helpful and that it gives you an added edge in creating interactive and dynamic Tableau dashboards for your projects.
At EdgeRed, we pride ourselves on leveraging the power of data visualisation and process automation to drive business insights and efficiencies. From automated visualisation for major Australian banks to creating centralised sales performance dashboards, EdgeRed’s proficiency in tools like Tableau, Google BigQuery, and various cloud platforms empowers businesses to make data-driven decisions effectively.
Frequently Asked Questions
Can I use other form tools besides Google Forms to collect user inputs in Tableau?
Yes, you can integrate other form tools like Microsoft Forms or SurveyMonkey with Tableau dashboards to collect user inputs. The process is similar to using Google Forms but may involve different steps for generating and integrating the form link. Ensure that the form's responses can be accessed and updated seamlessly within your Tableau dashboard.
How secure is the data submitted through Google Forms in Tableau?
Google Forms data is secured by Google’s robust security infrastructure, making it a reliable choice for collecting data. To enhance data security in your Tableau dashboards, ensure that your Google Form responses are shared only with authorized personnel. Additionally, use secure connection methods and encryption to further protect the data.
Can I automate the data flow from Google Forms to Tableau dashboards?
Yes, you can automate the data flow from Google Forms to Tableau dashboards using tools like Google Sheets in conjunction with Tableau’s web data connector. By setting up an automated refresh schedule, you ensure that your Tableau dashboard always displays the latest data submitted through Google Forms, eliminating the need for manual intervention.
This post was written by Nargess.
About the Author
Nargess Kazemi is a seasoned data visualisation expert with a Master’s degree in Artificial Intelligence and a Bachelor’s degree in Mathematics. With her fine attention to detail and a penchant for crafting creative technical solutions, Nargess has been instrumental in developing robust algorithms and effective data visualisation dashboards that have been widely recognised and utilised by businesses. When Nargess isn’t delving into data, she enjoys sharing her knowledge and mentoring fellow team members to foster a rich environment of learning and innovation at EdgeRed.
Subscribe to our newsletter to receive the our latest data analysis and reports directly to your inbox.

