Maximizing web traffic data: Integrating Google Analytics with Power BI for robust dashboarding
31 Jan 2024

Google Analytics is a great tool for tracking and analysing a million and one things about your website. That said, it isn’t perfect (fingers crossed Google doesn’t penalise this page in their search results for saying this). Sometimes there is a depth you need to add to your analysis that Google Analytics doesn’t quite have. Many things in life have a trade-off between complexity and optionality – that means as your options go up, the complexity does as well. In the case of Google Analytics reporting suite, they make it remarkably easy to use and pickup for people without a data background. The trade-off is less options for what you can create and visualise versus a dashboarding tool.
My old friend, Power BI
My first thought after playing around with Google Analytics for a bit was “can I bring this data into a more powerful dashboarding tool like Power BI?”. Power BI and I go way back. I first used it in 2018 with my second consulting client, a couple years after it was released. What I’m always surprised by whenever I pick it up again is the continuous improvements and new features that have been added since the last time I used it. I had a hunch they might have added Google Analytics Data interactivity, and I wasn’t disappointed.
What follows is a bit of my own experience doing exactly that, a bit of a showcase, and a bit of step-by-step tutorial if you want to follow along.
Tutorial: Navigating to the data
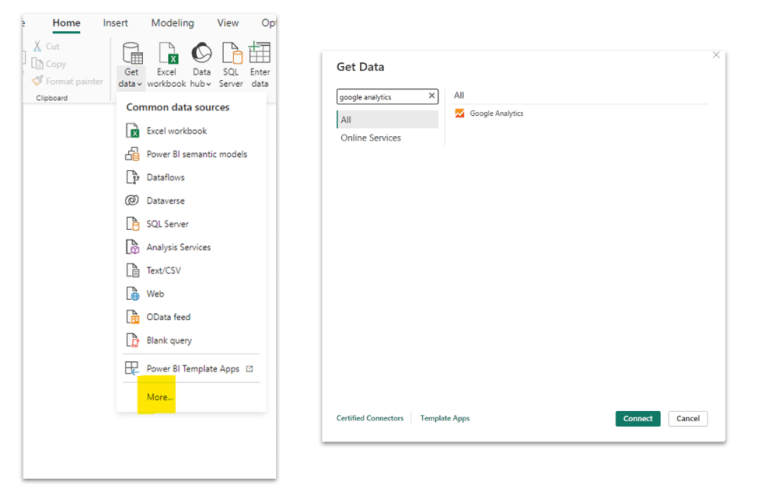
This part is surprisingly straightforward but also a bit more complicated than normal for Power BI. If you go to Get data, then click More…, you will see all the options for data import. Type Google Analytics into the search bar. Then click connect and select the 2.0 beta.
Tutorial: Selecting relevant data
From here you can select your data after expanding out the menu, as shown below. If you hover over individual fields a description will appear, explaining what it means in the context Google Analytics is presenting it in here. You will need to pick the fields that are relevant to you. I’ll list what I picked below. An important thing to note is that you will need to select at least one metric for anything to extract or display on the right.
Another thing to note is that once you pick your fields, you cannot change them in the normal method in the Power BI query editor. This seems to be a bug that hasn’t been resolved yet, so make sure to select everything you want to include the first time!
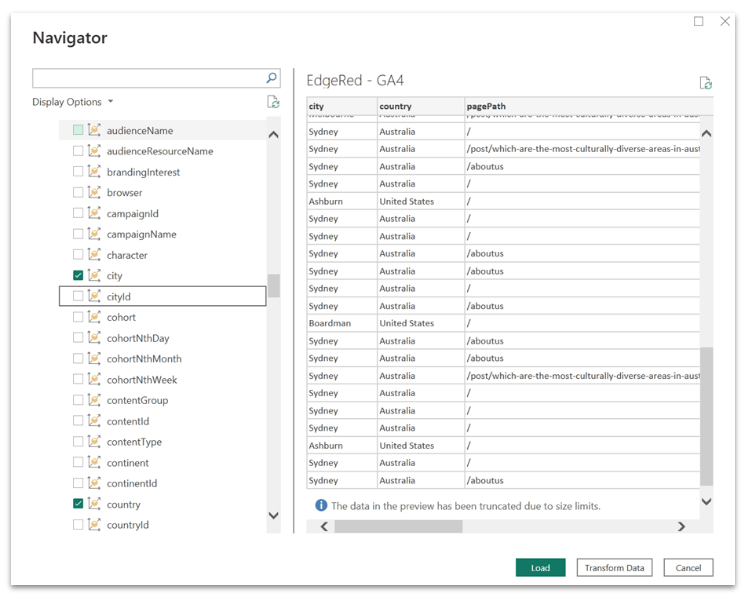
*note : I named my table Referrers
The fields I used
City – self explanatory. Combine with Country into a new column if you want to use this in a map, otherwise it will not be accurate
Try Location = Referrers[City] & “, ” & Referrers[Country]
Country – self explanatory
pagePath – which page are we measuring for
pageReferrer – this is the page that the user came from. This is useful but not clean, you might have 20 different google site variations and even more from your own site. Try something like
Referrer = IF(CONTAINSSTRING(Referrers[pageReferrer], “google.”), “google”,IF(CONTAINSSTRING(Referrers[pageReferrer], “edgered.com.au“), “edgered”,SUBSTITUTE(SUBSTITUTE(SUBSTITUTE(Refferrers[pageReferrer],”https://www.”,””),”https://”,””),”http://“,””))). Just swap out the edgered for your companies website and it will take care of a good deal of the cleaning for you.
yearMonth – YYYYMM year followed by month – this frequency keeps the data volume down while allowing measurement over time. I generally prefer working with monthly data
activeUsers – The number of distinct users who visited
bounceRate – did they close the webpage on this site? A high bounce rate would indicate that most users do, rather than navigating to another page within the environment
conversions (of various types) – Did the users interact with the site meaningfully
What you can do with this data
Now that we have the data, what do we do with it? The answer depends on the business question you are trying to answer, and what data you picked. At EdgeRed, we want to understand what is driving traffic to our site in terms of unique users (the answer, without going into specifics, is high quality blog posts and people who want to understand what the company does!). I’ll share a bit of what we’ve built.
Any data examples you can see in the dashboard photos are real but are not revealing anything too closely guarded based on the filters I’ve applied.
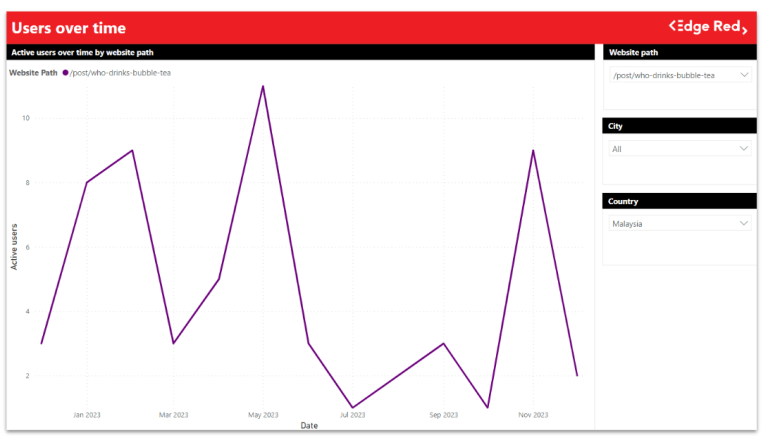
This chart is useful for tracking which pages had the most users over time. It’s a very good high-level place to start. You can see I’ve added slicers for the website, city and country to allow us to drill down as specific as we want to go. In this case it allows us to see web traffic for a specific page in a specific country. The only secret you’ll see in the previous image is that the Malaysian popularity of the who drinks bubble tea post has declined slightly over time. While this sounds negative, it isn’t statistically meaningful with that sample size.
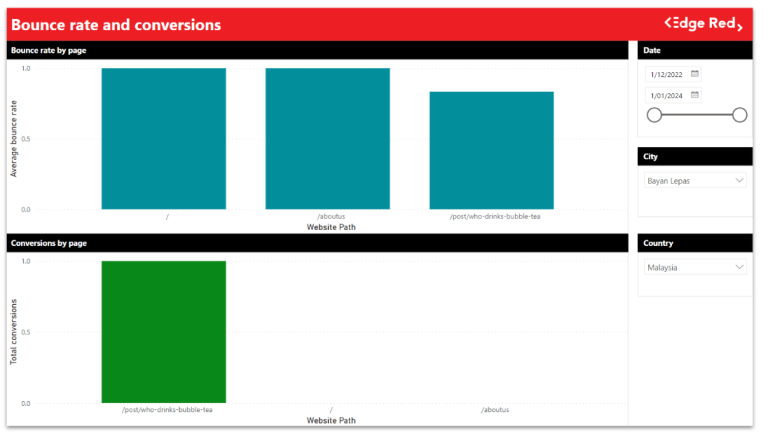
Next up we have bounce and conversion split by the website path/page. This will tell us which sites are interacted with most, and which sites lead to the most interaction on other pages within the EdgeRed website. We’ve also added a slicer for date, allowing us to select a specific date range. The bubble tea post I wrote a few years back brought in a reader from a random city in Malaysia. The bottom chart says they navigated to and read the blog post (a conversion as they are a new user by google default settings), then read about us to learn about the company who wrote it, and then probably decided that they didn’t need the services of a Sydney analytics consultancy while they are in Malaysia and bounced.
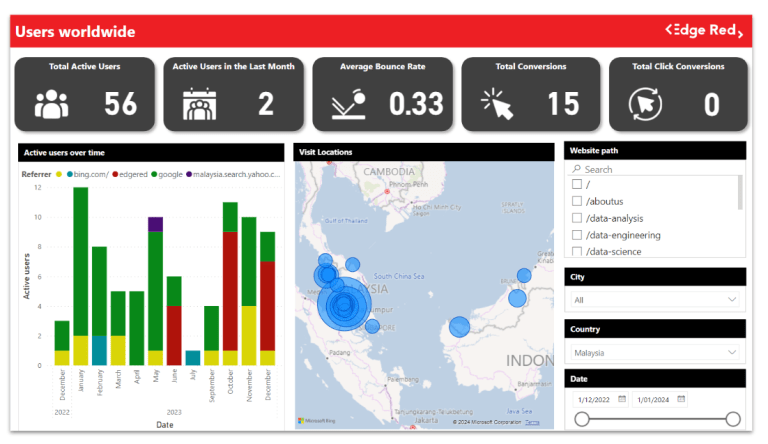
Finally, this is a webpage level stats page. Conceptually, it lets you pick a webpage and see all the metrics for a specific page based on slicer selection. On the left we’ve split the active users over time, with the colours corresponding with where the traffic came from. In our example, it seems to mostly have come directly from google. We can see where the traffic came from geographically on the map to the right, with the largest bubbles corresponding to the largest amount of active users.
Some Final Thoughts
Google Analytics has a lot of inbuilt metrics and dimensions that are easy to access and use, and some that the Power BI API can’t access. That said, if you’re a data practitioner who is experienced with dashboarding tools, you should try bringing your Google Analytics data into Power BI. It offers a lot more flexibility in options as long as you can work with the added complexity. The ability to slice and combine the data in any way you want with Power BI is powerful, which is one key area where Google Analytics is not as strong.
The final verdict: Both are great tools. Both tools do things the other can’t do. You need to use both PowerBI and Google Analytics to unlock the full value of your web traffic data – we will be using both at EdgeRed going forward!
Frequently Asked Questions (FAQs)
What are the advantages of using Power BI alongside Google Analytics for web data analysis?
Integrating Google Analytics data into Power BI offers several advantages for advanced data analysis. Power BI provides greater flexibility in visualising and manipulating data, allowing users to create custom dashboards and reports tailored to specific business questions. Unlike Google Analytics, Power BI enables more complex data modeling, advanced calculations, and seamless integration with other data sources beyond website analytics. This combination empowers data practitioners to unlock deeper insights and correlations within their web traffic data.
How can I effectively use Power BI to analyse Google Analytics data for website optimisation?
To leverage Power BI for Google Analytics data analysis, start by importing relevant data fields such as page views, traffic sources, bounce rates, and conversions into Power BI. Use Power BI's capabilities to create dynamic dashboards that visualize trends over time, identify high-traffic pages, and analyse user behavior patterns. Implement interactive features like slicers to drill down into specific regions, time periods, or page categories. By combining the strengths of both tools, you can gain actionable insights to optimise website performance and enhance user experience.
What are some limitations or challenges when integrating Google Analytics with Power BI?
While integrating Google Analytics with Power BI offers substantial benefits, there are a few considerations to keep in mind. One challenge is the complexity of data transformation and modeling within Power BI, especially when handling large volumes of website data. Additionally, certain Google Analytics features and dimensions may not be fully accessible or compatible with Power BI's data import capabilities, requiring manual adjustments or workarounds. Despite these challenges, the synergy between Google Analytics and Power BI significantly enhances data analysis capabilities, making it a valuable investment for data-driven organisations.
Explore the potential of combining Power BI and Google Analytics to maximize the value of your web traffic data. If you have further questions or need guidance on implementing this integration, feel free to reach out to our team at EdgeRed for personalized assistance and support!
About EdgeRed
EdgeRed is an Australian boutique consultancy specialising in data and analytics. We draw value and insights through data science and artificial intelligence to help companies make faster and smarter decisions.
Subscribe to our newsletter to receive our latest data analysis and reports directly to your inbox.

